Phenology
![]()
Observations
![]()
Probability of Sighting a Species
Avian Species Breeding in Vicinity
Twenty years ago, the arrival of American Robins in the Home ‘patch’ in early March was considered a prelude to spring. In the last five-to-seven years, robins were spotted in January and February even when there was snow on the ground. Now in the winters of 2021 through 2024, they are seen often, sometimes in flocks of ten or more. Using our AAP Application we explore such changing patterns of bird sightings and how these relate to the available food sources and climate.
We estimate the probability of sighting a bird species in a season based on the data collected in the last five years (2019 - 2023). Next, the evidence of breeding in the vicinity is examined. This is followed by our observations on some of the food sources (blossoms, seeds, and berries) and the habitat. Based on these observations, we can begin to plan some natural enhancements in the present habitat for attracting more wildlife. For a description of the habitat and data collection methodology see Home 'patch' habitat
Migratory birds spend fewer days in the ‘patch’ than those present all year in this part of the northeastern USA. Hence, we assign a resident term to all species to separate year-round residents from those that are here only in the summer or winter, or pass-through during migration using the Ralph T. Waterman Bird Club database on bird sightings over past 80 years. The resident terms are listed in Table 1 below: ‘Y’ for all year-round, ‘S’ for summer, ‘W’ for winter and ‘P” for passing through. Note that for some species these assignments may change over time.
Table 1 List of resident terms for avian species.
|
Resident Term |
Definition |
Examples |
|
Y |
All year-round |
Northern Cardinal, Downy Woodpecker |
|
S |
Summer |
Baltimore Oriole, Eastern Kingbird |
|
W |
Winter |
Dark-eyed Junco, Golden-crowned Kinglet |
|
P |
Passing through during migration |
Nashville Warbler, Philadelphia Vireo |
In the AAP Application, we get the FirstSeen and LastSeen dates on which a species was observed for the first time and the last time in a season respectively. For ‘S’ species, FirstSeen is in the spring and LastSeen is in the fall. For ‘W’ species, FirstSeen is in the fall and LastSeen is in the spring of the following year. When the period includes more than one year, FirstSeen and LastSeen are the earliest and the latest dates in all the years.
The days are numbered 1 through 365 (366 in a leap year). An ‘observation day’ is a day on which at least one avian species was recorded. This is to eliminate counting days on which the observer was away from home.
Next, we define the following parameters:
NT = Total number of days counted in a selected period
NO = Number of observation days in the same period as NT
NA = Number of days observer was away in the same period as NT
Hence, NT = NO + NA
NS = Number of days a specific species is sighted in the same period as NT; NS ≤ NO
DFS = Day of the year corresponding to FirstSeen for a species
DLS = Day of the year corresponding to LastSeen for a species
For species in ‘Y’ and ‘P’ category, NT is 365 (or 366) in one year. For species in the ‘S’ and the ‘W’ categories, NT is derived from two different methods. For ‘S’ species, the default period is set from 1st May to 15th September with NT = 138 days per summer season.
For ‘W’ species, the ‘year’ begins on 1st July of a calendar year and ends on 30th June of the following calendar year. The default period is from 1st October to 15th April of the following year. NT is 197 days per winter season. When the FirstSeen and/or LastSeen dates for a species fall outside the default periods, then NT is set equal to (DFS + 365 - DLS).
Examples for each category are shown in Table 2 for five-years, from 1st January 2019 to 31st December 2023. Note that for ‘W’ species, the winter season in 2023 is not included in NO.
|
Species |
Resident Term |
FirstSeen |
LastSeen |
NT |
NO |
|
American Crow |
Y |
1st January |
31st December |
= 365×4 + 366=1826 |
1657 |
|
Hairy Woodpecker |
Y |
15th March |
27th December |
= 365×2 + 366=1826 |
1657 |
|
Eastern Kingbird |
S |
12th May |
3rd September |
= 138×5 =690 |
623 |
|
Chipping Sparrow |
S |
1st April |
17th November |
= 231×5 = 1155 |
1034 |
|
Fox Sparrow |
W |
18th October |
6th March |
= 197×4 + 198=986 |
879 |
|
Dark-eyed Junco |
W |
6th October |
20th April |
= 202×4 + 203=1011 |
909 |
The probability of sighting a bird during its observation period is defined as

 ×100
×100
The probabilities PS for the 112 species observed in past five years (2019 – 2023) are plotted in Fig. 1 For this period NT = 1826 and NO = 1657 for ‘Y’ (all year-round) and ‘P (passing through) species. As PS for ‘P’ species is very small, no attempt is made to limit NT to the migratory season. NO for ‘S’ and ‘W’ species varies as described above.
The dashed line in Fig. 1 is a Gaussian distribution fit to the data. There are significant deviations from the fit at the upper end because of the higher-than-normal probability of observing birds that breed or roost nearby. The long tail in the distribution is partly introduced by the observer’s bias to search for rare visitors during migration and summer season. We use the standard deviation, σ, of PS = 20 to separate species into three groups: local, extended, and uncommon or rare. A fourth group of species observed in flight only are typically found in habitats different than in the ‘patch’.
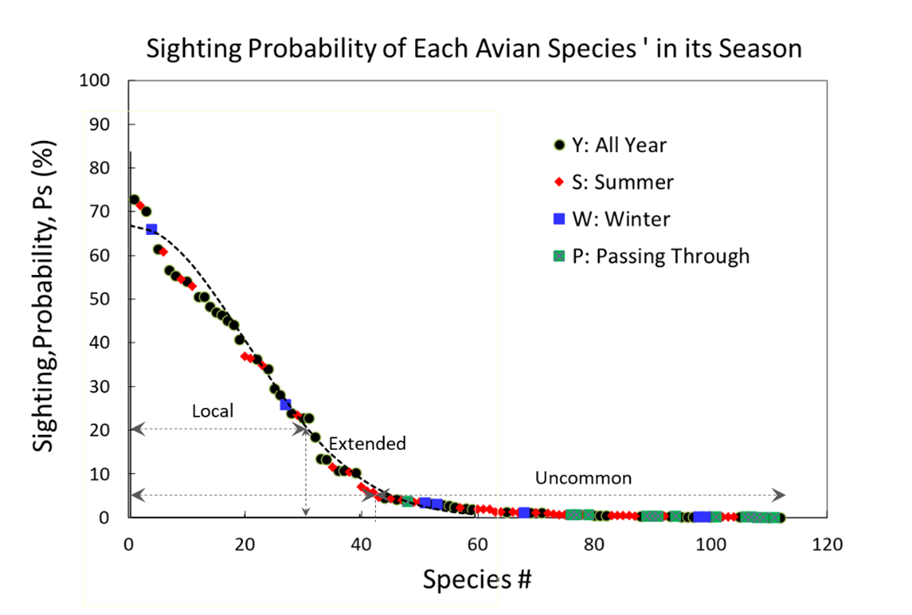
Fig.1 Sighting probability,Ps for 112 species in Home ‘patch’ in a five-year period (2019 to 2023). Data are fitted to a Gaussian distribution with standard deviation, σ = 20.
Table 3 Species class and corresponding Ps values.
|
Species class |
Range in σ |
PS (%) |
Species Count |
|
Local |
0 to 1.0 σ |
> 20 |
30 |
|
Extended |
1.0 σ to 2.0 σ |
> 5 and < 20 |
11 |
|
Uncommon or Rare |
> 2.0 σ |
< 5 |
62 |
|
In flight only |
|
> 0.1 and < 24 |
9 |
Based on the definitions in Table 3, we find 31 species stayed in the vicinity of local (Home ‘patch’) area, 11 species had an extended range, 62 were uncommon or rare visitors and nine were observed only as they flew by. More detailed discussion of these species including breeding codes, juvenile sightings, and maximum count follows.
Two examples of records in the AAP database are shown below. The column headings are self-explanatory. Species types are ‘A’ for adult, ‘M’ for male, ‘F’ for female and ‘J’ for juvenile or chick and are noted wherever possible; the default is ‘A’. BrCode is a Breeding Code published by New York State Breeding Bird Atlas to classify breeding related activities. The codes are listed in Appendix A More details can be found in https://ebird.org/atlasny/about/breeding-codes
The example records below describe a song sparrow feeding two chicks. Photographs when available are included as evidence.
|
ObservationDate |
ObservationTime |
Bird |
Type |
NumberSighted |
BrCode |
Comments |
|
5/31/2021 |
7:00 |
Song Sparrow |
A |
1 |
FY |
Feeding chicks |
|
5/31/2021 |
7:00 |
Song Sparrow |
J |
2 |
O |
|
Juvenile sightings are recorded when either a fledgling is following or fed by an adult or when juvenile plumage of a species is distinct. Juveniles may be fledglings or immature birds. Note that juvenile plumages in different species may be present anywhere from a few weeks to a year (Cooper’s Hawk) or even several years (Bald Eagle).
The nine species observed only in flight are listed in Table 4 These are typically large birds (vultures, raptors) that soar, fly across a wide area, or travel between different bodies of water. They are not observed to be feeding or nesting and are excluded from breeding and foraging analysis.
Table 4 Nine avian species observed only in flight in 2019- 2023.
|
|
Species |
Resident Term |
Sighting Probability, PS (%) |
Family Type |
|
1 |
Turkey Vulture |
Y |
24.0 |
New world vulture |
|
2 |
Bald Eagle |
Y |
2.1 |
Raptor |
|
3 |
Osprey |
S |
1.9 |
Raptor |
|
4 |
Ring-billed Gull |
Y |
1.1 |
Coastal seabird |
|
5 |
Black Vulture |
Y |
0.5 |
New world vulture |
|
6 |
Red-shouldered Hawk |
Y |
0.2 |
Raptor |
|
7 |
Common Nighthawk |
P |
0.1 |
Nightjar |
|
8 |
Green Heron |
S |
0.1 |
Wading bird |
|
9 |
Double-crested Cormorant |
S |
0.1 |
Coastal seabird |
The species that were often seen in the local area in the summer do feed and may breed within this area. We use the nesting data, Breeding Codes and sighting of young immature birds shown in Table 5 as additional confirmation. MaxCount indicates the maximum number of birds seen at the same time in the time-period for NT. Accurate counts of birds are challenging. Numbers larger than 5 may be underestimated and counts for large flocks are best guess. Maximum count of > 20 indicates that a species travels in a large flock, typically outside the breeding season.
Of the 31 species with PS > 20, we may eliminate winter residents Dark-eyed Junco and White-throated Sparrow, and Turkey Vulture observed only in flight, from the breeding list. For the remaining 28 species, breeding activity or juvenile birds were observed for all species except for Common Grackle.
Table 5 List of 30 local species and Turkey Vulture (in flight only) with breeding codes, juvenile sightings, probability of sighting (PS) and maximum count.
|
|
Species |
Resident Term |
Breeding Code |
# of Juvenile Sightings |
Sighting Probability PS (%) |
Max. count |
|
1 |
American Robin |
Y |
NY |
85 |
72.9 |
100 |
|
2 |
Chipping Sparrow |
S |
NY |
78 |
71.5 |
30 |
|
3 |
Blue Jay |
Y |
CN |
0 |
70.2 |
20 |
|
4 |
Dark-eyed Junco |
W |
O |
0 |
65.9 |
30 |
|
5 |
Northern Cardinal |
Y |
NY |
31 |
61.4 |
5 |
|
6 |
Gray Catbird |
S |
CN |
12 |
60.8 |
4 |
|
7 |
Canada Goose |
Y |
FL |
9 |
56.7 |
150 |
|
8 |
Tufted Titmouse |
Y |
FL |
7 |
55.4 |
6 |
|
9 |
Ruby-throated Hummingbird |
S |
NY |
0 |
54.6 |
4 |
|
10 |
House Finch |
Y |
NY |
12 |
54.1 |
29 |
|
11 |
Eastern Wood-Pewee |
S |
FL |
2 |
53.0 |
3 |
|
12 |
American Crow |
Y |
CN |
0 |
50.5 |
80 |
|
13 |
Mourning Dove |
Y |
CN |
1 |
50.5 |
20 |
|
14 |
Northern Mockingbird |
Y |
FY |
3 |
48.3 |
5 |
|
15 |
Carolina Wren |
Y |
NY |
4 |
47.0 |
4 |
|
16 |
European Starling |
Y |
FL |
11 |
46.4 |
500 |
|
17 |
Eastern Bluebird |
Y |
FY |
115 |
45.0 |
12 |
|
18 |
Black-capped Chickadee |
Y |
FL |
1 |
44.1 |
6 |
|
19 |
Red-tailed Hawk |
Y |
NY |
24 |
40.8 |
4 |
|
20 |
Barn Swallow |
S |
FY |
6 |
36.9 |
51 |
|
21 |
Eastern Phoebe |
S |
FL |
7 |
36.4 |
3 |
|
22 |
White-breasted Nuthatch |
Y |
FL |
1 |
36.3 |
3 |
|
23 |
Baltimore Oriole |
S |
FY |
28 |
34.8 |
5 |
|
24 |
Red-bellied Woodpecker |
Y |
FY |
17 |
34.1 |
4 |
|
25 |
Northern Flicker |
Y |
FY |
10 |
29.6 |
5 |
|
26 |
Downy Woodpecker |
Y |
FY |
9 |
28.1 |
4 |
|
27 |
White-throated Sparrow |
W |
O |
0 |
25.9 |
10 |
|
28 |
Turkey Vulture |
Y |
F |
0 |
24.0 |
7 |
|
29 |
House Wren |
S |
FL |
7 |
23.5 |
5 |
|
30 |
Common Grackle |
Y |
O |
0 |
22.8 |
200 |
|
31 |
American Goldfinch |
Y |
FY |
7 |
22.8 |
14 |
The extended species listed in Table 6 were either seen less often or not seen in one or two out of the five years. Of the 11 species, breeding activity or juveniles were not seen in the following 2 species.
1. Red-eyed Vireo: May be breeding nearby but juveniles were not identified.
2. Great Blue Heron: This wading bird nests in tall trees near water and unlikely to choose a location in or around the ‘patch’.
Table 6 List of 11 Extended Species with breeding codes, juvenile sightings, probability of sighting (Ps) and maximum count.
|
|
Species |
Resident Term |
Breeding Code |
Juvenile Sightings |
Sighting Probability PS (%) |
Max. count |
|
32 |
Brown-headed Cowbird |
Y |
NY |
1 |
18.4 |
25 |
|
33 |
Song Sparrow |
Y |
FY |
20 |
13.5 |
3 |
|
34 |
Pileated Woodpecker |
Y |
FL |
1 |
13.3 |
3 |
|
35 |
Great Crested Flycatcher |
S |
CN |
4 |
11.6 |
3 |
|
36 |
Cedar Waxwing |
Y |
O |
7 |
10.9 |
20 |
|
37 |
Great Blue Heron |
Y |
O |
0 |
10.9 |
4 |
|
38 |
Red-eyed Vireo |
S |
CF |
0 |
10.4 |
4 |
|
39 |
Red-winged Blackbird |
Y |
O |
10 |
10.3 |
70 |
|
40 |
Eastern Kingbird |
S |
O |
8 |
7.1 |
5 |
|
41 |
Scarlet Tanager |
S |
CN |
6 |
6.1 |
4 |
|
42 |
Wood Thrush |
S |
O |
0 |
5.8 |
1 |
There are remaining 62 rare or uncommon visitors and 8 observed only in flight. Of these species with 1 < Ps < 5, are listed in Table 7a and those with Ps < 1 in Table 7b. The five ‘W’ species (Ruby Crowned Kinglet, Golden-Crowned Kinglet, Fox Sparrow, American Tree Sparrow and Pine Siskin) travel north during the breeding season. Passing through ‘P’ species are present only for a short time on their journey to north in the spring and on the return path in the fall.
There are two species records with juvenile sightings:
Cooper’s Hawk is around all year, and the juvenile is easily distinguishable from the adult in the first year with its dark vertical streaks on the front. Adult Cooper’s Hawk has reddish horizontal stripes.
Blackpoll Warbler breeds in the boreal forests of Canada and passes through here in spring and fall on its way to South America. At least four juveniles (no lateral throat-stripe) and one adult in molt were spotted on the dogwood trees.
Table 7 List of 29 rare or uncommon species with Ps > 1. Those observed in flight only are shaded in gray.
|
|
Species |
Resident Term |
Breeding Code |
Juvenile Sightings |
Sighting Probability PS (%) |
Max. count |
|
43 |
Rose-breasted Grosbeak |
S |
O |
5 |
4.7 |
4 |
|
44 |
Cooper's Hawk |
Y |
O |
6 |
4.5 |
2 |
|
45 |
Black-throated Green Warbler |
S |
O |
0 |
4.4 |
3 |
|
46 |
Barred Owl |
Y |
O |
0 |
4.2 |
2 |
|
47 |
Tree Swallow |
S |
O |
1 |
4.0 |
15 |
|
48 |
Yellow-rumped Warbler |
P |
O |
0 |
3.7 |
6 |
|
49 |
Warbling Vireo |
S |
O |
0 |
3.5 |
4 |
|
50 |
Blue-headed Vireo |
S |
O |
0 |
3.5 |
2 |
|
51 |
Golden-crowned Kinglet |
W |
O |
0 |
3.4 |
2 |
|
52 |
Yellow-bellied Sapsucker |
Y |
O |
2 |
3.2 |
3 |
|
53 |
Ruby-crowned Kinglet |
W |
O |
0 |
3.1 |
2 |
|
54 |
Hairy Woodpecker |
Y |
O |
0 |
3.0 |
3 |
|
55 |
Mallard |
Y |
P |
0 |
2.8 |
11 |
|
56 |
Fish Crow |
Y |
O |
0 |
2.4 |
26 |
|
57 |
Black-and-white Warbler |
S |
O |
0 |
2.3 |
2 |
|
58 |
Bald Eagle |
Y |
F |
4 |
2.1 |
2 |
|
59 |
Brown Creeper |
Y |
O |
0 |
2.0 |
2 |
|
60 |
Yellow Warbler |
S |
CF |
0 |
2.0 |
2 |
|
61 |
Osprey |
S |
F |
0 |
1.9 |
2 |
|
62 |
Yellow-billed Cuckoo |
S |
O |
0 |
1.9 |
1 |
|
63 |
Bank Swallow |
S |
O |
0 |
1.3 |
3 |
|
64 |
Cliff Swallow |
S |
O |
0 |
1.3 |
3 |
|
65 |
House Sparrow |
Y |
O |
0 |
1.3 |
3 |
|
66 |
American Redstart |
S |
O |
0 |
1.3 |
1 |
|
67 |
Chestnut-sided Warbler |
S |
O |
0 |
1.2 |
1 |
|
68 |
Fox Sparrow |
W |
O |
0 |
1.2 |
2 |
|
69 |
Mute Swan |
Y |
O |
0 |
1.2 |
5 |
|
70 |
Blue-gray Gnatcatcher |
S |
O |
0 |
1.1 |
2 |
|
71 |
Ring-billed Gull |
Y |
F |
0 |
1.1 |
10 |
Table 7b List of 41 rare or uncommon species with Ps < 1. Those observed in flight only are shaded in gray.
|
|
Species |
Resident Term |
Breeding Code |
Juvenile Sightings |
Sighting Probability PS (%) |
Max. count |
|
72 |
Eastern Towhee |
S |
O |
0 |
0.9 |
2 |
|
73 |
Blackburnian Warbler |
S |
O |
0 |
0.8 |
1 |
|
74 |
Wood Duck |
S |
O |
0 |
0.8 |
2 |
|
75 |
Yellow-throated Vireo |
S |
O |
0 |
0.8 |
2 |
|
76 |
Northern Parula |
P |
O |
0 |
0.7 |
2 |
|
77 |
Swainson's Thrush |
P |
O |
0 |
0.7 |
1 |
|
78 |
Magnolia Warbler |
S |
O |
0 |
0.7 |
1 |
|
79 |
Blackpoll Warbler |
P |
O |
9 |
0.6 |
4 |
|
80 |
Field Sparrow |
Y |
O |
0 |
0.6 |
2 |
|
81 |
Black Vulture |
Y |
F |
0 |
0.5 |
6 |
|
82 |
Hermit Thrush |
Y |
O |
0 |
0.5 |
1 |
|
83 |
Northern Rough-winged Swallow |
S |
O |
0 |
0.5 |
16 |
|
84 |
Prairie Warbler |
S |
O |
0 |
0.5 |
1 |
|
85 |
Common Yellowthroat |
S |
O |
0 |
0.5 |
1 |
|
86 |
Indigo Bunting |
S |
O |
0 |
0.5 |
1 |
|
87 |
Brown Thrasher |
S |
O |
0 |
0.4 |
1 |
|
88 |
Killdeer |
Y |
O |
0 |
0.4 |
1 |
|
89 |
Nashville Warbler |
P |
O |
0 |
0.4 |
1 |
|
90 |
Palm Warbler |
P |
O |
0 |
0.4 |
3 |
|
91 |
White-crowned Sparrow |
P |
O |
0 |
0.4 |
2 |
|
92 |
Purple Martin |
S |
O |
0 |
0.3 |
1 |
|
93 |
Merlin |
Y |
O |
0 |
0.3 |
1 |
|
94 |
Tennessee Warbler |
P |
O |
0 |
0.3 |
2 |
|
95 |
Common Raven |
Y |
O |
0 |
0.2 |
2 |
|
96 |
Red-shouldered Hawk |
Y |
F |
0 |
0.2 |
1 |
|
97 |
Sharp-shinned Hawk |
Y |
O |
0 |
0.2 |
1 |
|
98 |
American Tree Sparrow |
W |
O |
0 |
0.2 |
1 |
|
99 |
Pine Siskin |
W |
O |
0 |
0.2 |
2 |
|
100 |
Common Merganser |
Y |
O |
0 |
0.2 |
5 |
|
101 |
Rusty Blackbird |
P |
O |
0 |
0.2 |
6 |
|
102 |
Green Heron |
S |
F |
0 |
0.2 |
1 |
|
103 |
Least Flycatcher |
S |
O |
0 |
0.2 |
1 |
|
104 |
Orchard Oriole |
S |
O |
0 |
0.2 |
1 |
|
105 |
American Kestrel |
Y |
O |
0 |
0.1 |
1 |
|
106 |
Canada Warbler |
P |
O |
0 |
0.1 |
1 |
|
107 |
Philadelphia Vireo |
P |
O |
0 |
0.1 |
2 |
|
108 |
Black-throated Blue Warbler |
P |
O |
0 |
0.1 |
1 |
|
109 |
Common Nighthawk |
P |
F |
0 |
0.1 |
1 |
|
110 |
Double-crested Cormorant |
Y |
F |
0 |
0.1 |
27 |
|
111 |
Pine Warbler |
P |
O |
0 |
0.1 |
1 |
|
112 |
Wild Turkey |
Y |
O |
0 |
0.1 |
1 |
There is some variation from year to year in the total number of bird species sighted in the small area of the Home ‘patch’. Sighting of uncommon species is dependent on chance as well as observer skill and effort. In Table 8 the species count in each of the four resident term categories is listed. As observer skill improved from 2019 and 2020, the counts became similar in 2021, 2022 and 2023 in the “Y”, “S” and “W” categories. The counts in the “P” category dropped in 2023 – this was the year when many migratory birds flew in a more westerly route to avoid heavy rains in the northeastern USA. Hence, during migration, observations in a small area mimic a larger area.
Table 8. Number of species sighted each year in each resident term category.
|
Year |
Y- All Year |
S - Summer |
W - Winter |
P -Passing Through |
Total |
|
2019 |
39 |
26 |
5 |
5 |
75 |
|
2020 |
42 |
28 |
4 |
8 |
82 |
|
2021 |
44 |
33 |
5 |
8 |
90 |
|
2022 |
46 |
31 |
4 |
9 |
90 |
|
2023 |
44 |
31 |
5 |
3 |
83 |
We estimate the total number of birds sighted in the Home ‘patch’ by summing the maximum number of birds for each species recorded during a year. These are listed in Table 9. Flocks with estimated counts greater than 100 for American Robin, Canada Goose, Common Grackle and European Starling are excluded to prevent large errors in the total count. The maximum count is between 400 and 600. The number of species with juvenile sightings remained the same in 2021, 2022 and 2023. The number of species confirmed breeding code are also listed.
Table 9. Total count of birds sighted each year (flocks of > 100 birds are excluded), number of species with juvenile sightings and confirmed breeding code.
|
Year |
Maximum Bird Count |
Number of species with juvenile sightings |
Number of species with confirmed breeding code |
|
2019 |
447 |
16 |
5 |
|
2020 |
497 |
27 |
14 |
|
2021 |
433 |
23 |
18 |
|
2022 |
576 |
22 |
14 |
|
2023 |
502 |
22 |
22 |
In Fig. 2, the probability Ps in each year is plotted for local avian species listed in Table 5. The species # in the x-axis is ordered by descending Ps in 2021. The values for some species vary more than for others. In 2019 only species identified by sight were recorded and Ps values are generally lower for most species. As observer skills improved, species identified by sight as well as vocalization were included for the other four years. Some variations in year-to-year sightings are expected because of how data are collected and observer effort. Large variations can sometimes be accounted for by nesting and winter roosting location preferences and by food source availability.
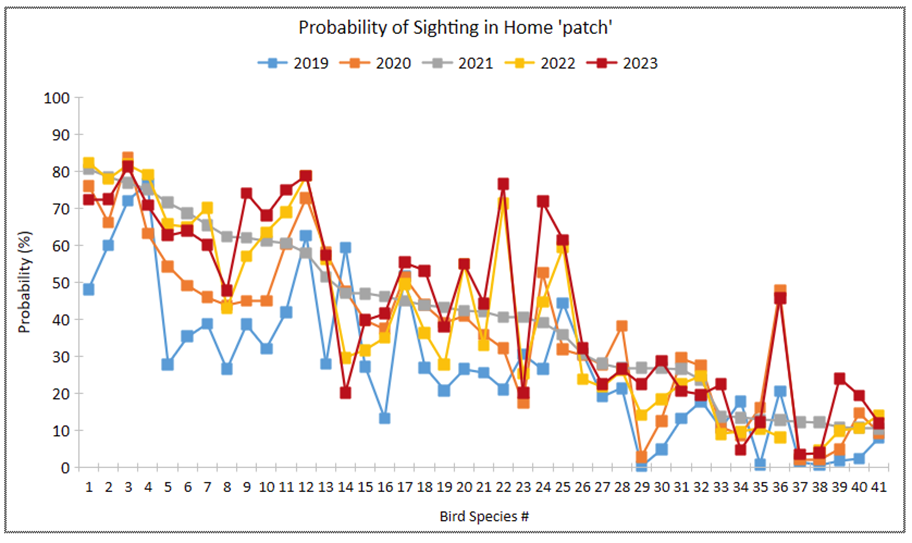
Fig. 2 Sighting probability Ps in each year for local avian species listed in Table 5. The species # in the x-axis is ordered by descending Ps in 2021 and does not match the #s in Table 5.
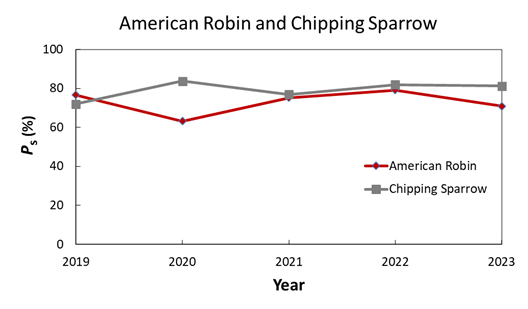
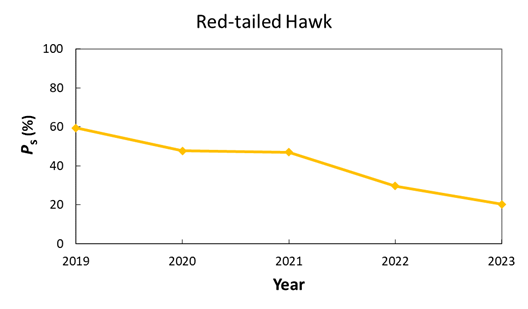
Next, we compare the sighting probability Ps for the local species. Generally, Ps values are higher for species nesting within the Home ‘patch’. American Robin and Chipping Sparrow have nested close to the house in all the five years, and their Ps values, are nearly the same over time as shown in Fig. 3a. Red-tailed Hawk nested within or just beyond the Home ‘patch’ only in 2019, 2020 and 2021 and Ps values, declined in the following years as shown in Fig. 3b.
(a)
(b)
Fig. 3 Ps from 2019 to 2023 for a) American Robin and Chipping Sparrow, and b) Red-tailed Hawk.
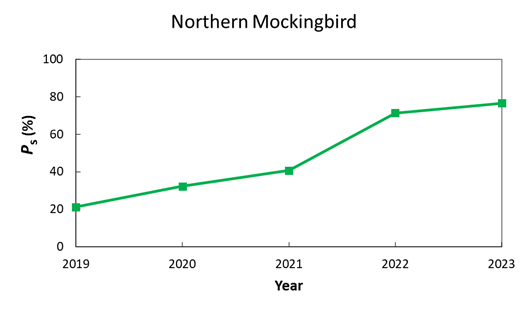
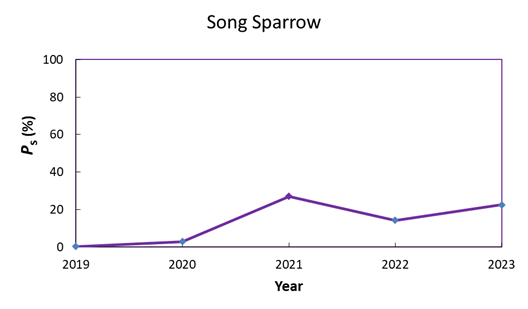
Changes in Ps values of Northern Mockingbird, an all-year resident, are shown in Fig. 4a. One Northern Mockingbird has chosen to roost in a deciduous shrub next to the house since 2020. In 2020 and 2021 this bird was not seen in the summer. In 2022 and 2023, he paired with a female and nested in the Home ‘patch’. This change in preference and behavior is reflected in the Ps values. Song Sparrow, another all-year resident in the northeastern USA, was rarely seen in 2019 and 2020 (Fig. 4b). A pair was nesting somewhere in the Home ‘patch’ in 2021, and recently fledged young were seen in late summer. The nest location may have moved in 2022 and 2023, but a pair was seen during the nesting season.
(a)
(b)
Fig. 4 Ps from 2019 to 2023 for a) Northern Mockingbird and b) Song Sparrow.
Birds seek suitable habitat, food, and shelter; these demands vary during the year. Changes in daylight hours are gradual and predictable. Average day and night temperatures change with seasons although day-to-day variations of 20oC (40oF) at extreme limits may pose survival challenges. Heavy downpours, thunderstorms, changes in barometric pressure, and snowfall and ice storms in the winter may occur with very little notice. Let us see how the birds in the Home ‘patch’ cope with these situations.
Birds must find food to survive. Most songbirds feed on insects in the winter and change diet to a mix of insects and berries in the summer and fall. In 2020 through 2023 we recorded birds seen feeding on berries, seeds, and blossoms in AAP Applicationas described in Appendix A. An entry was made only when there was positive evidence. As an example, a bird seen with a berry or part of a berry in its beak confirms that it is feeding. On the other hand, a bird perched on a tree full of berries is not sufficient evidence and not included in the records.
The common and botanical names of plants and trees producing blossoms and berries in the Home ‘patch’ are listed in the Flora table in the AAP Application< A ‘Flora Group’ comprises several shrubs or trees of the same type. For example, Flora group ‘Dogwood’ includes four dogwood trees, dogwood1, dogwood2, dogwood3 and dogwood4. As the berries on these trees mature at different times, we can track feeding on each dogwood tree individually or on all four in the same group. A cluster of flowering perennials in a Flora Group such as Coneflower is treated as one Flora. Example entries in the table are shown below:
|
Flora ID |
ObservationDate |
Item |
FavoredBird |
|
Bee Balm - Purple |
8/18/2021 |
Blossoms |
Ruby-throated Hummingbird |
|
Coneflower |
8/28/2021 |
Seed |
American Goldfinch |
|
Dogwood2-white |
10/16/2021 |
Fruit |
Blackpoll Warbler |
Species that are seen feeding in the years 2020 - 2023 are listed in Table 10, along with the number of Flora Groups they feed on. In the summer, Ruby-throated Hummingbird is observed drinking nectar from blossoms of as many as 14 flowering perennials and vines. These perennials are favorites of butterflies and insects as well, but of no other avian species. American Goldfinch prefers seeds of flowering plants such as coneflower and bee balm and is the only seed eating bird here. The remaining 39 species in Table 10 feed on berries of different shrubs and trees. The Dogwood Flora Group attracts the largest number of species including some in the ‘P’ (passing-through) category.
Table 10 Number of Flora Groups providing food for different bird species.
|
|
Species
|
Resident Term |
Flora Group |
|
1 |
Ruby-throated Hummingbird |
S |
14 |
|
2 |
American Goldfinch |
Y |
11 |
|
3 |
American Robin |
Y |
11 |
|
4 |
Eastern Bluebird |
Y |
8 |
|
5 |
Gray Catbird |
S |
7 |
|
6 |
Northern Cardinal |
Y |
5 |
|
7 |
House Finch |
Y |
5 |
|
8 |
Northern Mockingbird |
Y |
5 |
|
9 |
Cedar Waxwing |
Y |
4 |
|
10 |
Song Sparrow |
Y |
4 |
|
11 |
Dark-eyed Junco |
W |
3 |
|
12 |
Eastern Phoebe |
S |
3 |
|
13 |
Northern Flicker |
Y |
3 |
|
14 |
European Starling |
Y |
3 |
|
15 |
Scarlet Tanager |
S |
3 |
|
16 |
White-throated Sparrow |
W |
3 |
|
17 |
Black-capped Chickadee |
Y |
3 |
|
18 |
Tufted Titmouse |
Y |
3 |
|
19 |
Red-bellied Woodpecker |
Y |
3 |
|
20 |
Carolina Wren |
Y |
2 |
|
21 |
Chipping Sparrow |
S |
2 |
|
22 |
Common Grackle |
Y |
2 |
|
23 |
American Redstart |
S |
2 |
|
24 |
Blue Jay |
Y |
2 |
|
25 |
Red-eyed Vireo |
S |
2 |
|
26 |
Eastern Kingbird |
S |
2 |
|
27 |
Blackpoll Warbler |
P |
1 |
|
28 |
Blue-headed Vireo |
S |
1 |
|
29 |
American Kestrel |
Y |
1 |
|
30 |
Baltimore Oriole |
S |
1 |
|
31 |
Brown-headed Cowbird |
Y |
1 |
|
32 |
Canada Goose |
Y |
1 |
|
33 |
Fox Sparrow |
W |
1 |
|
34 |
Yellow-bellied Sapsucker |
Y |
1 |
|
35 |
Mourning Dove |
Y |
1 |
|
36 |
Red-winged Blackbird |
Y |
1 |
|
37 |
Rose-breasted Grosbeak |
S |
1 |
|
38 |
Rusty Blackbird |
P |
1 |
|
39 |
Swainson's Thrush |
P |
1 |
|
40 |
Warbling Vireo |
S |
1 |
|
41 |
Eastern Wood-Pewee |
S |
1 |
Detailed descriptions of the popularity of different food sources follow. Examination of these food sources and their values to the avian population, suggests modifications to the landscaped area to attract more wildlife.
In the future, we plan to include other food sources such as bugs, worms, and insects in our study as well.
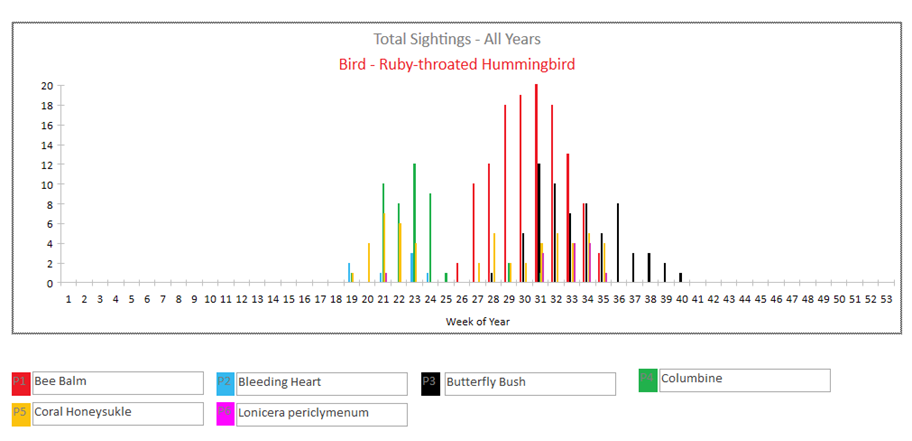
The Flora groups visited by Ruby-throated Hummingbirds are shown in Fig. 5. Of these, Coral Honeysuckle (Lonicera sempervirens) has the longest blooming season, from early May through the end of October. It is popular with hummingbirds, but the vine is not well visible from inside the house. Hence, the number of visits to this vine may be underestimated.
Most of the summer we see only female Ruby-throated Hummingbirds on the blossoms. A male is seen only early in the season. The females are territorial, and one female dominates the planting bed, vigorously chasing away any intruder. Many pollinators (butterflies, moths, bees, wasps) also visit the same blossoms as the hummingbird. There appears to be no serious contention among the insects and the hummingbird.
The bee balm (Monarda didyma) patch is the hummingbird’s favorite food source. The red variety blooms earlier than the purple variety, but there is an overlap; hence the number of sightings is larger than the observed number of days.
After drinking nectar from several blossoms, one female hummingbird often perched on a lower dead branch of the dogwood tree near the bee balm plants. From this viewpoint, she could rest and guard her food supply, quickly chasing away other hummingbirds.
Year to year variation in the feeding time and frequency is displayed in Fig. 6. Hummingbirds were feeding most frequently in 2021. In 2022, when a hummingbird was nesting in the American elm tree in the Home ‘patch’, she was drinking nectar more regularly only after the chicks fledged. This pattern was repeated in 2023, but no nest was confirmed nearby.
 <
<
Fig. 5 Main sources of food in the Home ‘Patch’ during the year for Ruby-throated Hummingbird.
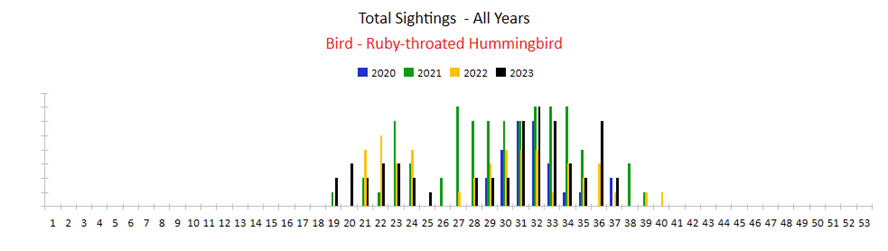
Fig. 6 Year to year variation in the feeding frequency of Ruby-throated Hummingbirds in the Home ‘patch’.
American Goldfinch is the only species feeding on flower buds and seeds. Fig. 7 shows its six main sources of food in the Home ’patch’ during the year. In April, these birds feed on the buds of American Elm (Ulmus americana) tree. In July and August, purple coneflower (Echinacea purpurea) and bee balms seeds are favored.
Year to year variation in the use of food sources is shown in Fig. 8. Goldfinch sightings were similar in all years. However, in 2023, they were feeding much less frequently in the Home ‘patch’. This was the only year in which no juveniles were spotted in the breeding season. American elm buds were consumed more heavily in 2020 and 2022 (weeks 14-16).
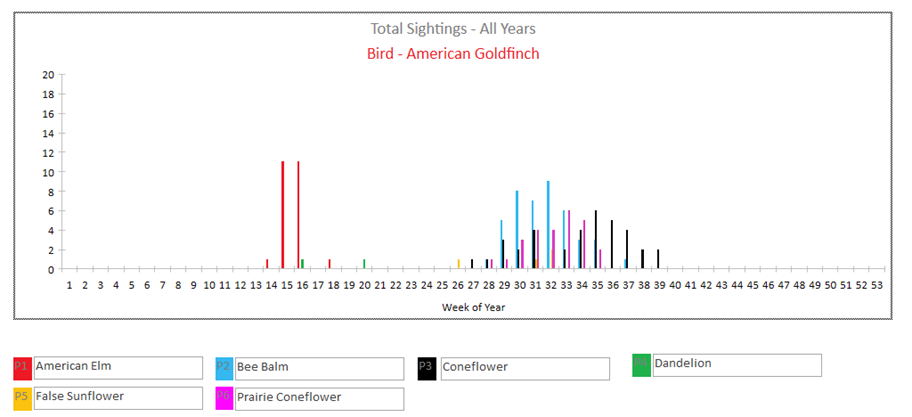
Fig. 7 Main sources of food during the year in the Home ‘patch’ for American Goldfinch.
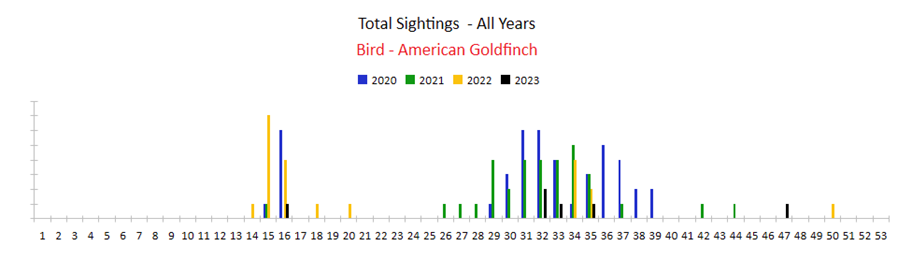
Fig. 8 Year to year variation in the feeding frequency of American Goldfinch in the Home ‘patch’.
The birds ate berries from many shrubs and trees. The top favored berry producing Flora Groups and the number of avian species feeding are listed in Table 11.
Table11. Numbers of species feeding on the five Flora groups in four years (2020 – 2023).
|
|
Flora Group |
# of species |
|
1 |
Flowering Dogwood (Cornus florida) |
26 |
|
2 |
Bradford Pear (Pyrus calleryana) |
18 |
|
3 |
Bush Honeysuckle (Lonicera morowii) |
8 |
|
4 |
Black Cherry (Prunus serotina) |
7 |
|
5 |
Pokeberry (Phytolacca) |
7 |
|
6 |
Jetbead (Rhodotypos scandens) |
5 |
|
7 |
Winterberry (Ilex verticillate) |
4 |
The Dogwood Flora group comprises three self-seeded native flowering trees with white blossoms in the second and third weeks of May and a ‘native’ tree with pink blossoms purchased from a nursery. Ripe red berries of these trees in fall are a favorite of many avian species, gray squirrels, and chipmunks. As many as 26 species have been observed eating berries. These are listed in Table 12.
Table 12 List of avian species feeding on dogwood berries in the years 2020 - 2023.
|
|
Avian species feeding on Dogwood berries |
|
1 |
American Goldfinch |
|
2 |
American Robin |
|
3 |
Black-capped Chickadee |
|
4 |
Blackpoll Warbler |
|
5 |
Blue-headed Vireo |
|
6 |
Cedar Waxwing |
|
7 |
Chipping Sparrow |
|
8 |
Dark-eyed Junco |
|
9 |
Eastern Bluebird |
|
10 |
Eastern Phoebe |
|
11 |
European Starling |
|
12 |
Fox Sparrow |
|
13 |
Gray Catbird |
|
14 |
House Finch |
|
15 |
Northern Cardinal |
|
16 |
Northern Flicker |
|
17 |
Northern Mockingbird |
|
18 |
Red-bellied Woodpecker |
|
19 |
Red-eyed Vireo |
|
20 |
Rose-breasted Grosbeak |
|
21 |
Scarlet Tanager |
|
22 |
Swainson's Thrush |
|
23 |
Tufted Titmouse |
|
24 |
Warbling Vireo |
|
25 |
White-throated Sparrow |
|
26 |
Yellow-bellied Sapsucker |
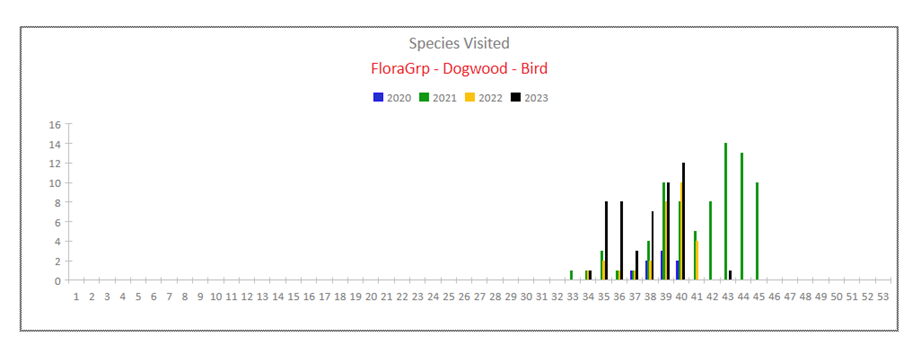
Fig. 9 Year to year variation in the number of species feeding on dogwood berries in the Home ‘patch’.
There is considerable variation from year to year of the species that feed on these berries and the duration as shown in Fig. 9. In some years, gray squirrels consume most of the berries while these are still green, leaving a smaller supply of ripe berries for the birds. Nature Movie ‘Flowering Dogwood Trees’ illustrates how wildlife is attracted to these trees.
The second most popular berry producing trees are Bradford pears. These trees are in the yards of neighboring houses on the east, south and west sides of the house. Birds seen feeding on these berries from late November to early January are listed in Table 13. Year to year variation in feeding times and frequencies are shown in Fig. 10. In 2020, early frost damaged the buds and there was no berry crop. The winter of 2021-2022 had the longest feeding season, starting in November 2021 and ending in late January 2022.
Table 13 Avian species feeding on Bradford pear trees.
|
|
Avian species feeding on Bradford pear berries |
|
1 |
American Robin |
|
2 |
Black-capped Chickadee |
|
3 |
Blue Jay |
|
4 |
Cedar Waxwing |
|
5 |
Common Grackle |
|
6 |
Dark-eyed Junco |
|
7 |
Eastern Bluebird |
|
8 |
European Starling |
|
9 |
House Finch |
|
10 |
Northern Cardinal |
|
11 |
Northern Mockingbird |
|
12 |
Red-bellied Woodpecker |
|
13 |
Song Sparrow |
|
14 |
White-throated Sparrow |
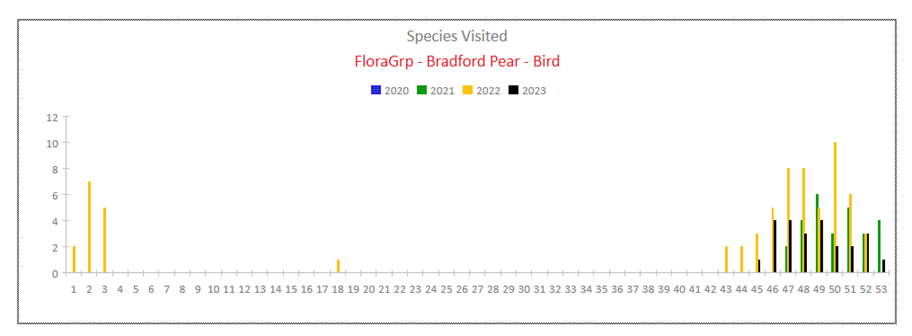
Fig. 10 Year to year variation in the number of species feeding on Bradford pears in the Home ‘patch’.
Acorns on the pin oaks (Quercus palustris) are heavily favored by Blue Jays. From early September to mid-October, Blue Jays are frequently seen trafficking acorns from the oak trees to other destinations.
Some avian species are seen feeding on several different Flora groups. Fig. 11 shows the frequency of American Robins feeding on six different Flora Groups during 2020- 2023. Bush honeysuckle berries ripen in June and these berries are also fed to nestlings. Black cherries in early August, dogwood berries in September and October, and Bradford pears from November to January serve as food sources for about six months of the year.
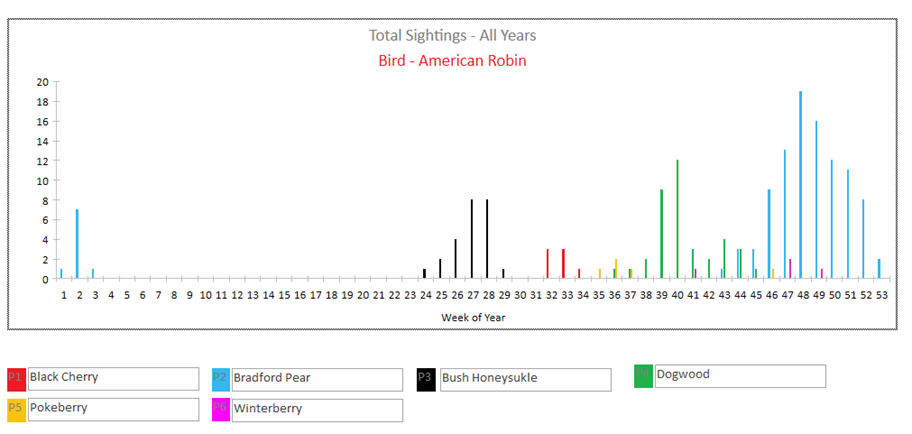
Fig. 11 Berry consumption of American Robins from different Flora Groups during the year.
Songbirds look for favorable nesting locations, proximity of food sources, safe places to roost, shelter from inclement weather and locations providing quick getaway from predators while foraging or feeding fledglings. American Robin has nested under the deck and Carolina Wren under the lid of a propane tank next to the house. Other songbirds prefer to build nests in vines, shrubs, trees and natural cavities in the woods. Evergreen shrubs and trees, dense deciduous shrubs and brush piles in the woods are suitable for shelter in all seasons. Perches two to ten feet high in grassy areas or at the edge of the woods are convenient for finding insects.
Changes in habitat occur during the year and from year to year as influenced by the amount of rainfall, temperature swings, landscaping choices and other factors. One measure of these changes is the observed numbers of species nesting in and near the Home ‘patch’. In Table 14 the number of species with a nest in the Home ‘patch’ and those seen feeding or foraging with fledglings spotted in the Home ‘patch’ are listed. The drought in the fall of 2022 provided dry branches and twigs as nesting material, and as many as 11 species were seen collecting nesting material at the edge of the woods in the spring of 2023. Also in 2023, there was an abundance of insects, partly because of a spongy moth infestation, and the berry crop was good because of a wet summer. These are likely causes for the increase in the number of nests and fledglings seen. Although observer skill and effort over the years has improved, these sightings do reflect year to year variations in the breeding activities because of environmental and habitat changes.
Table 14. Number of avian species observed nesting and seen with fledglings in the Home ‘patch’, and those nesting nearby.
|
Year |
Collecting nesting material |
Nesting |
With fledglings |
Nesting nearby |
|
2019 |
3 |
2 |
1 |
0 |
|
2020 |
3 |
3 |
7 |
2 |
|
2021 |
6 |
2 |
9 |
1 |
|
2022 |
6 |
4 |
7 |
3 |
|
2023 |
11 |
5 |
12 |
9 |
It has been a primary goal to keep a wildlife friendly natural environment in the Home ‘patch’. Native shrubs and trees, and perennials favored by nectar and seed eating birds have been planted and maintained. Some food sources are shared by both animals and birds, and their consumption is not controlled. As an example, gray squirrels may consume a large proportion of dogwood berries in some years and not as much in other years.
The variations in rainfall, snow cover and other such environmental factors in the last five years have been within expected normal fluctuations. This is too short a period to notice any effect of global warming and climate change. However, the observations made in this small Home ‘patch’ appear to mimic year to year variations in a much larger surrounding area suggesting that careful monitoring of representative small patches may be an efficient approach to tracking climate change effects on wildlife.
Breeding Codes published by New York State Breeding Bird Atlas 2020-2024
Note: Code ‘FD’ is in addition to the published list
|
Breeding Code |
Description |
Category |
|
F |
Flyover |
none |
|
O |
Observed |
none |
|
FD |
Feeding |
none |
|
H |
In appropriate habitat |
Possible |
|
S |
Singing bird |
Possible |
|
S7 |
Singing male (7+ days) |
Probable |
|
M |
Multiple (7+) singing males |
Probable |
|
P |
Pair in suitable habitat |
Probable |
|
T |
Territorial defense |
Probable |
|
C |
Courtship, display or copulation |
Probable |
|
N |
Visiting probable nest site |
Probable |
|
A |
Agitated behavior |
Probable |
|
B |
Wren/Woodpecker nest building |
Probable |
|
PE |
Physiological evidence |
Confirmed |
|
CN |
Carrying nesting material |
Confirmed |
|
NB |
Nest building |
Confirmed |
|
DD |
Distraction display |
Confirmed |
|
UN |
Unused nest |
Confirmed |
|
ON |
Occupied nest |
Confirmed |
|
FL |
Recently fledged young |
Confirmed |
|
CF |
Carrying food |
Confirmed |
|
FY |
Feeding young |
Confirmed |
|
FS |
Carrying fecal sac |
Confirmed |
|
NE |
Nest with eggs |
Confirmed |
|
NY |
Nest with young |
Confirmed |
Glossary of Symbols
|
Symbol |
Description |
Units/Limits |
|
D |
Day number of the year |
1 to 365/366 |
|
DFS |
Day number when a species is FirstSeen |
|
|
DLS |
Day number when a species is LastSeen |
|
|
FS |
Date of first sighting in a period |
None |
|
LS |
Date of last sighting in a period |
None |
|
NA |
Number of days observers did not record any avian species |
None |
|
NO |
Number of observation days when at least one avian species is sighted |
None |
|
NS |
Number of days a specific species is sighted |
None |
|
NT |
Total number of days in a specific period |
|
|
PS |
Probability of sighting of a species |
None |
|
P |
Species passing through during mibration |
|
|
S |
Summer resident species |
|
|
W |
Winter resident species |
|
|
Y |
All-year resident species |
|