
Scientific Experiments
![]()
Passive Acoustic Monitoring
![]()
Watch a Wood Thrush singing in the Home 'patch'
Knowing that each Wood Thrush has a unique set of songs or repertoire, and that it is difficult to locate these birds by sight, we undertook identifying individual Wood Thrushes in the Home 'patch' by recording and analyzing their songs. Over the years 2021, 2022, 2023 and 2024, we found eight different Wood Thrushes singing in the Home 'patch'. Our methodology for identifying these individuals and findings from the audio recordings are documented in the links below:
Here we include a detailed description of the methodology for comparing the 'ee-oh-lay' parts in the repertoires using spectrograms of audio recordings along with examples of Wood Thrushes heard in the Home 'patch' and other far-off locations. The musical lure of the Wood Thrush, so appealing to humans, is shown to have the frequencies in the standard piano musical scale.
We established that the wood thrush singing in the woods in the Home 'patch' in May 2021 was a different individual than the one singing in the same area a year later, all through June of 2022.
In 2023, a Wood Thrush sang in the Home 'patch' only on two days in late mid-summer. All four of the songs in his repertoire were somewhat similar to the Home 'patch' Wood Thrush of 2022. Was it the same individual that returned after a year with an altered voice, an offspring of the 2022 bird, or another bird from the area near my 'patch'? We cannot be sure.
A Wood Thrush was singing on some days from May 7 through July 26. The song analysis revealed that there were five unique repertoires, indicating five individuals. Only one Wood Thrush was singing on any day. Four of these stayed for a day or two in early spring while the fifth sang on many days from June 11 to July 26.
Wood Thrush vocalization dates and times
How well does a Wood Thrush reproduce a song
Appendix A: Noise reduction and sources of error
Appendix B: Musical lore of a Wood Thrush
The melodious song of a Wood Thrush echoing through the woods in the northeastern United States is both sweet and haunting. These birds arrive here in early May after wintering in Central America and Mexico. Only the male is known to sing after arrival, and during the breeding season which ends in early to mid July. It is usually difficult to locate a Wood Thrush in a dense forest, but he lets you know he is there by singing away.
It was sheer delight to hear a Wood Thrush in the woods behind my house for a few days two years in a row. I wanted to know more about this elusive bird through his voice, the only way I knew of his presence.
Was it the same individual in my woods in 2021 and 2022? Will he return next spring?
Our team analyzed the Wood Thrush songs I had recorded at sunrise and sunset in 2022 over a two-week period. From these we learned his musical lure and unique vocalization patterns, different from those of the Wood Thrush in 2021 and three other Wood Thrushes in the northeatern USA. Now we may well be able to identify this bird if he safely journeys back to my 'patch' next spring, without using bands or other visual markers.
Below is a description of our findings.
Wood Thrush Vocalization Dates and Times
On the 15th of May 2021, when I returned after a birding field trip with a friend, we heard the 'ee-oh-lay' song of a Wood Thrush coming from the woods behind my house. We stopped on the driveway and listened. Yes, it was a Wood Thrush. We both knew the characteristic 'ee-oh-lay' song, typically heard in large wooded areas around here. It was the first time in twenty-three years that there was a Wood Thrush in my own Home 'patch'!
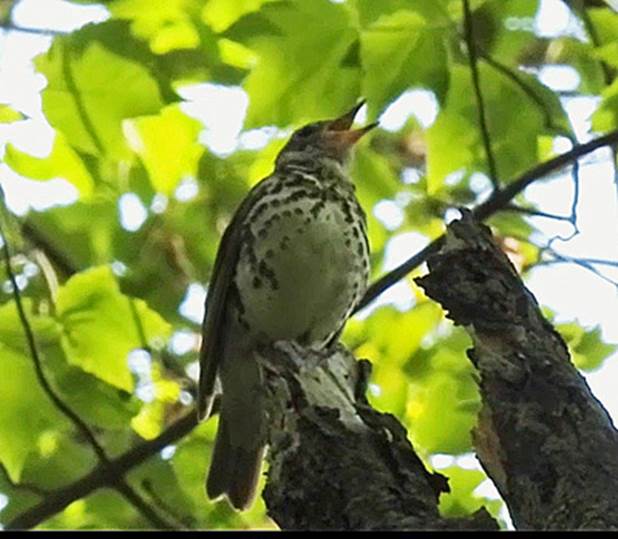
David, who was visiting from Massachusetts, and I searched the woods to find this elusive bird. He was singing away, the sound reverberating through the trees, but it took over an hour to locate him. He was perched on a dead branch and continued to sing - unperturbed by us or our cameras. We snapped a few photos and David recorded a video of the bird as he sang.
I heard the eerie songs of this Wood Thrush off and on for the next twelve days, and then he was silent.
A year later, on May 17, 2022, I heard a Wood Thrush, his loud and clear melodies coming into my living room. He must have been at the edge of the woods in my backyard, about fifty feet away, but hidden from view in the dense foliage. Then from June 2 to June 20, he sang several times each day. Sometimes he was close and sometimes the sound came from deeper in the woods, but always loud enough to be heard inside my home. A few times, early in the morning, he gave loud, agitated staccato 'pit pit' calls, and then resumed to melodious singing.
I started recording his lilting voice at sunrise and at sunset from June 8 onwards and noted the singing times during the day when I was at home and not distracted by other noise. His singing became less frequent and for shorter durations from June 21 to June 23. I did not hear him at all on June 24, briefly on June 25 and for the last time on June 27, just before sunset.
From the collection of twenty-one audio recordings of about one minute each, we now have a 'fingerprint' of this bird's repertoire. We also recorded three other Wood Thrush songs in New York and Massachusetts. Each bird had a unique signature representing his identity.
Details of our findings are described here. We are preparing for next year and hope to enhance our learning of the Wood Thrush species then with better instrumentation and more rigorous observations.
The presence of a Wood Thrush established from his singing in the spring of 2021 and 2022 is shown in Fig. 1.1. He vocalized at sunrise and at sunset, repeating short phrases or songs for fifteen to thirty minutes and for shorter durations of two to five minutes during the day. Singing during the day was more pronounced between June 10 and June 20 (Fig. 1.2). The clock time for vocalization on June 12 as well as the local sunrise and sunset timings are shown in Fig. 1.3. He started twenty-four minutes before sunrise, and his last bout began about twenty minutes before sunset. During the day, he vocalized more often in the morning and evening hours.
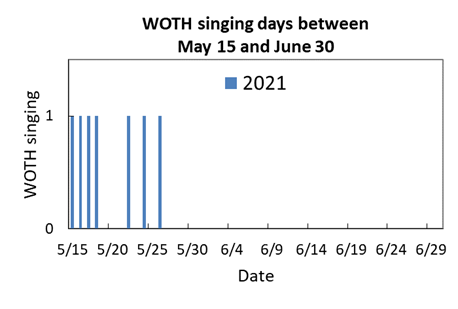
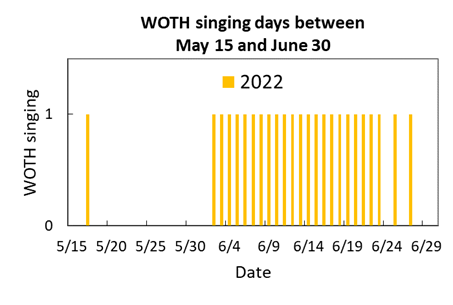
Fig. 1.1 Wood Thrush singing dates (represented by vertical bars) between May 15 and June 30 in 2021 and 2022.
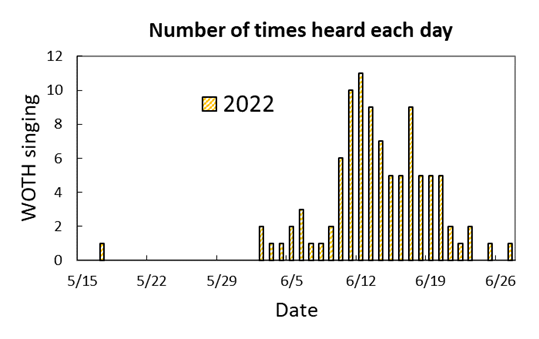
Fig. 1.2 Number of times heard the Wood Thrush each day.
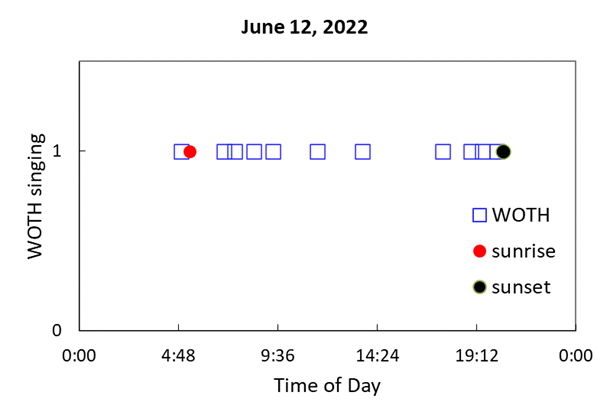
Fig. 1.3 Vocalization times as recorded on June 12 and the local sunrise and sunset timings.
We used the Merlin App on an iPhone and a small shotgun microphone with wind filter (either Movo PR-2-PM or Saramonic) to record the songs. The audio files in '.wav' format for this bird, named WOTH-2, were analyzed using Raven Pro software from Cornell University. The procedure for noise reduction and some sources of error are listed in Appendix A
Listen to a Wood Thrush singing in my Home 'patch' in 2022
Fig. 1.4 shows the oscillogram and spectrogram of a forty-nine second recording of WOTH-2 on June 14, 2022. It has 13 songs, each lasting 1.2 to 1.5 seconds with a gap of ~ 2.5 seconds between songs.
Looking at the spectrogram of an individual song more closely in Fig. 1.5, there are three elements of each song, p1, p2 and p3. The first part 'p1' is a low frequency, low volume 'bup' sound, repeated two or three times. The second part 'p2' is the characteristic 'ee-oh-lay' with which most birders associate the Wood Thrush. The third part 'p3' is a trill in a higher frequency range. In all recordings 'p2' is present, but 'p1' and 'p3' may be absent. Both 'p1' and 'p3' are difficult to hear because of lower sound volumes and high frequency attenuation of 'p3' when the bird is further away in the woods.
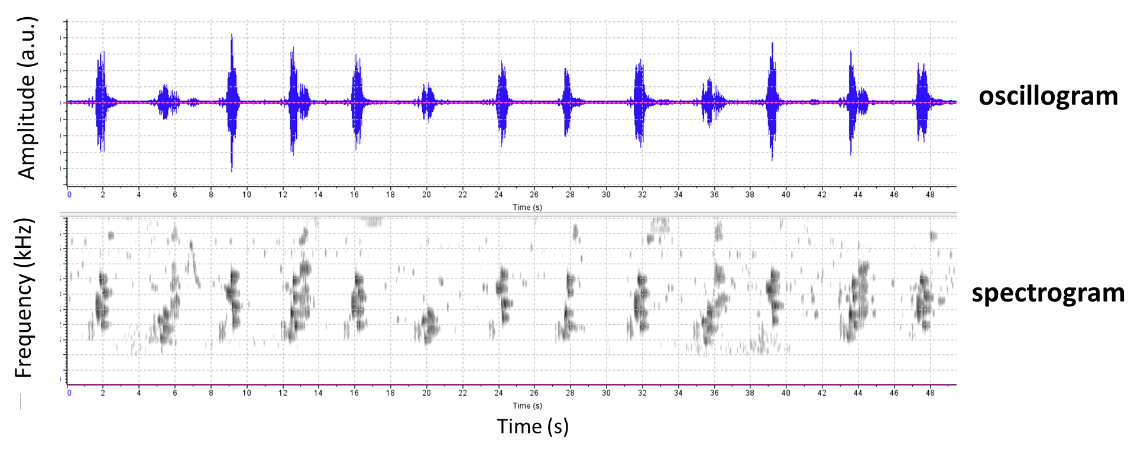
Fig. 1.4 Oscillogram (microphone pressure/amplitude vs. time) and spectrogram (frequency vs. time) of an audio recording on June 14, 2022. This recording contains thirteen individual songs.
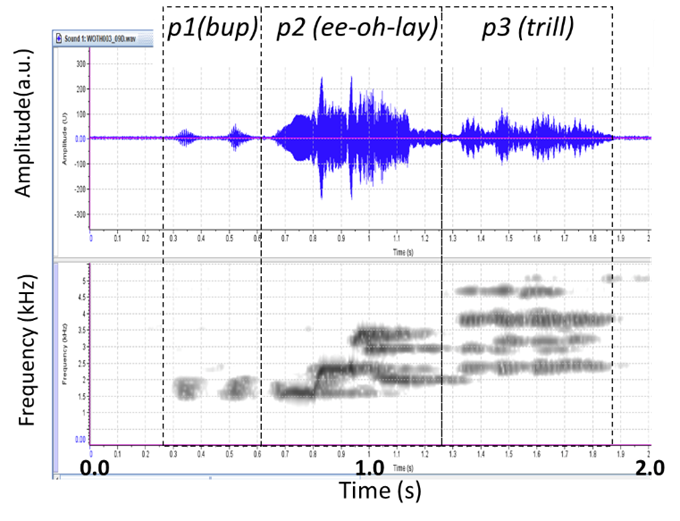
Fig. 1.5 The p1, p2 and p3 elements of the Wood Thrush song.
We characterized each song by its 'p2' element. There are four variations of this element, labeled A, B, C and D. The designation is arbitrary, but as discussed later, we labeled these in the preferred sequence used by the bird. The spectrograms of these variations are shown in Fig. 1.6. Each element comprises four or five frequency bands with different starting and ending times. Although the general 'ee-oh-lay' pattern is maintained, these variations are clearly distinguishable when listening carefully or from the spectrograms of the audio recordings.
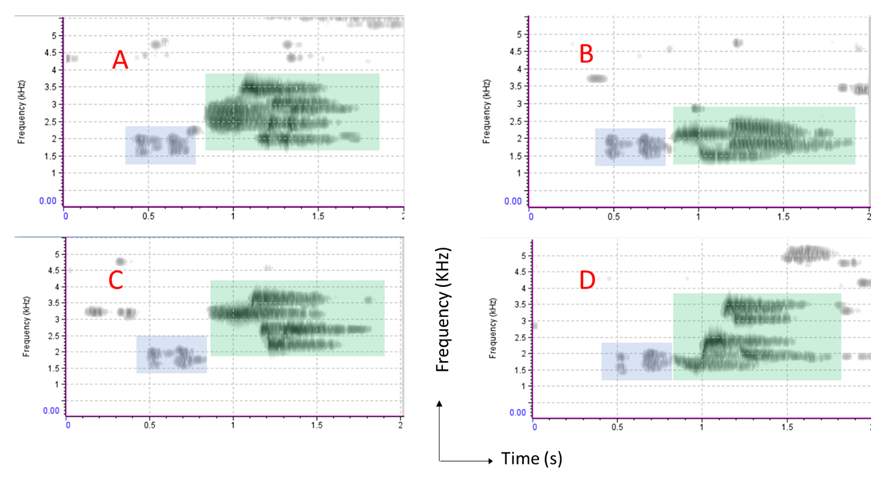
Fig. 1.6 Spectrograms of the four variations of 'p2' element shaded green rectangles.
Further examination of the spectrograms revealed small variations in the frequencies and timings within each of the four 'p2' elements produced at different times within the same recording and in recordings made on different days or different times of the day. To quantify how well the song types are repeated, we utilized Raven Pro software from Cornell University.
A rectangular box was drawn by hand around each of the frequency bands in the spectrogram as shown in Fig. 1.7, with the left side of the box close to the start time. The following two parameters were calculated for each band:
1. Center Frequency: The frequency that divides the selection into two frequency intervals of equal energy.
2. Relative Start Time: start time of each band with respect to the earliest start time.
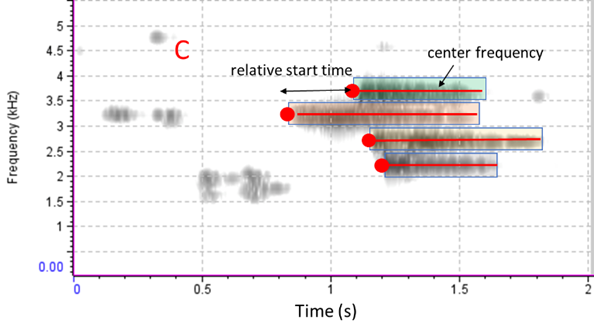
Fig. 1.7 Rectangular boxes covering each of the four frequency bands in song C.
In Fig. 1.8, the center frequency is plotted against relative start time for each song type in an audio recording shown in Fig. 1.4. There are small variations for each song type, but the overall pattern is preserved.
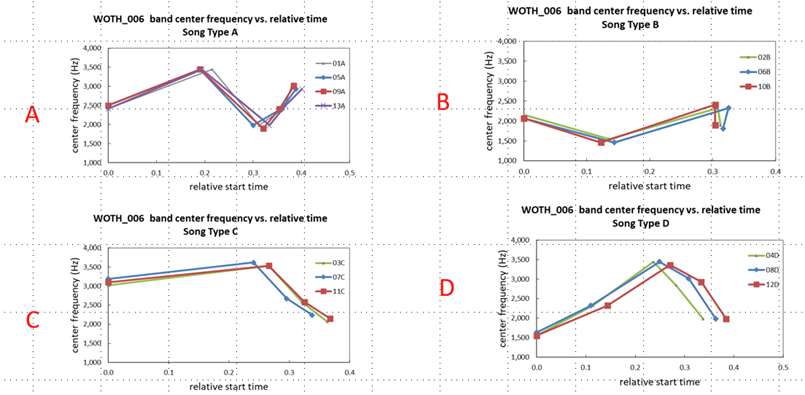
Fig. 1.8 Center frequency vs. relative start time for the four song types of WOTH-2.
The sequence in which the bird sang different songs was typically A, B, C and D but sometimes one of the song types was missing or the order was changed. In all the recordings with a total of 235 songs, we did not find any case where a song type was immediately followed by the same song type. Fig. 1.9 shows a matrix with % values of one song type followed by another song type. For example, song A was never followed by song A, 67% of the time it was followed by song B, 15% of the time by song C and 18% of the time by song D. Similarly, 19% of the time song C was followed by song A, 16% of the time by song B, 67% of the time by song D and never by song C. This non-repetitive pattern adds to the musical charm of his song (Appendix B.)
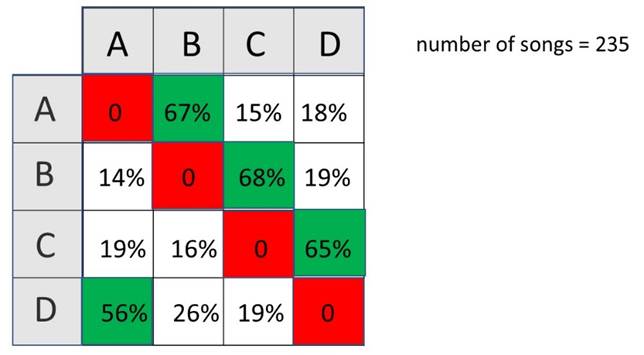
Fig. 1.9 A 2 x 2 matrix showing how often a song type was followed by same or another song type
How well does a Wood Thrush reproduce a song
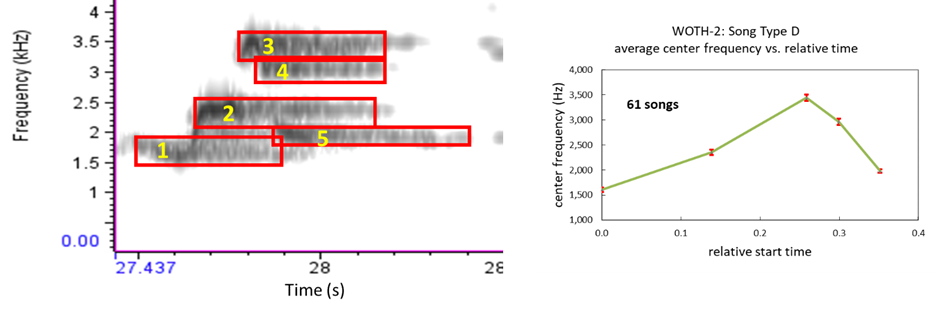
We examined sixty-one song D recordings of the WOTH-2 obtained between June 8 and June 21, 2022. For each recording, we measured the center frequency and relative start time of the five bands in the song as shown in Fig. 1.10 (a). In Fig. 1.10 (b) the average center frequency of sixty-one songs is plotted against average relative start time. Red error bars indicate the standard deviation of center frequency which is ≤ 2.7%.
<
(a)
(b)
Fig. 1.10 (a) Spectrogram of song D showing five rectangles for measuring center frequency and relative start time, (b) average center frequency vs. average relative start time of sixty-one song D recordings. Red error bars show standard deviation of center frequency
The start time of each band is the time corresponding to the left-side of the rectangle. The rectangle is hand drawn, and may result in a small error in the start time.
Fig. 1.11 shows the (a) average center frequency and (b) average relative start times with red error bars indicate maximum variation range, (maximum - minimum) value in sixty-one songs.
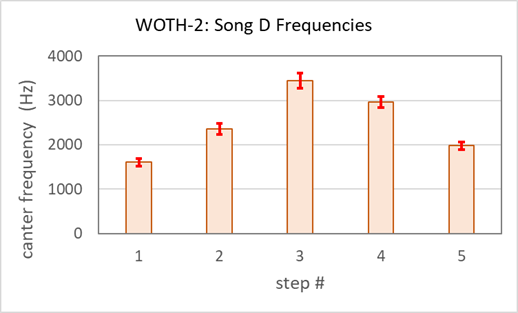
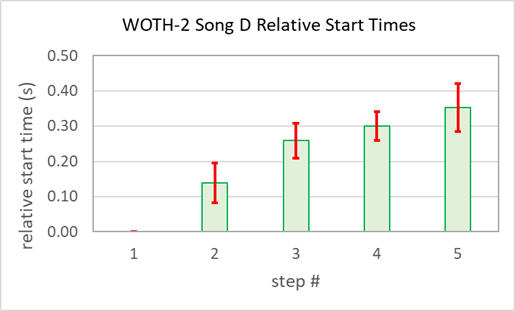
(a)
(b)
Fig. 1.11 Bar charts of (a) center frequency and (b) relative start time of bands 1 to 5 for song D. Red error bars show (maximum - minimum) range.
In early July when the WOTH-2 in the Home 'patch' became silent, we went in search of other Wood Thrushes. Our team member Mark recorded two birds in Hadley, Massachusetts (at Mitch's Marina on the Connecticut river and Mt. Holyoke), about 100 miles from the Home 'patch'. A third recording was made about twenty miles from the Home 'patch' in Millbrook, New York. By mid July we did not find any singing Wood Thrushes in our limited search in areas where these birds were singing regularly in May and June.
Each of the three birds also had four distinct songs, somewhat different from our resident bird. The spectrograms of their songs are shown in Figs. 1.12, 1.13 and 1.14, with 'p2' elements highlighted by shaded green areas. Both Mt. Holyoke and Millbrook Wood Thrush recordings contained 'p1' elements, and 'p3' element were present only in the Millbrook recording. The Millbrook bird was very close, perhaps 30 feet or less away, but we were not able to locate him. His voice was the loudest, and details of the 'p3' element are visible in the spectrogram - although sometimes it overlapped with the 'p2' element.
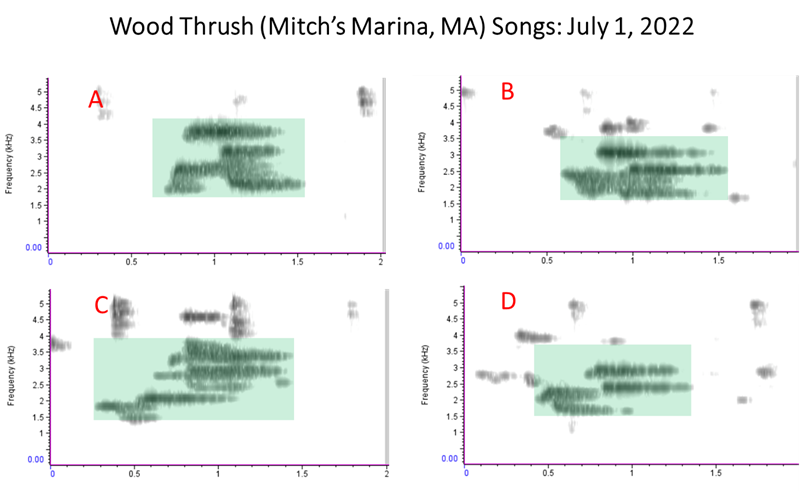
Fig. 1.12 Spectrograms of the four songs of the Wood Thrush at Mitch's Marina, Hadley, Massachusetts.
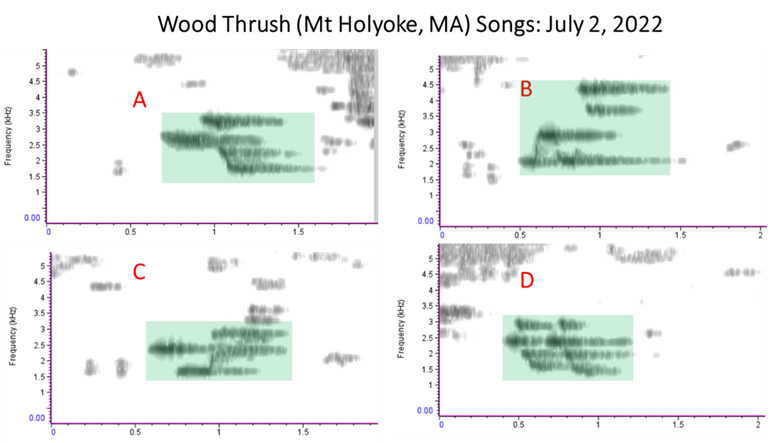
Fig. 1.13 Spectrograms of the four songs of the Wood Thrush on Mt. Holyoke, Hadley, Massachusetts.
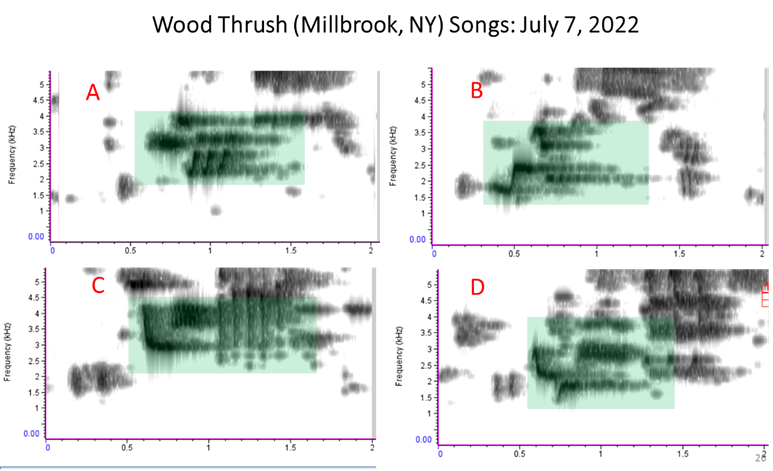
Fig. 1.14 Spectrograms of the four songs of the Wood Thrush in Millbrook, NY.
Comparing Different Wood Thrushes
The 'p1' elements of WOTH-2, Mt. Holyoke and Millbrook WOTHs when detected were similar - with 'bup' calls made in the 1.2 kHz to 1.5 kHz frequency range and a period between 0.15 s and 0.18 s.
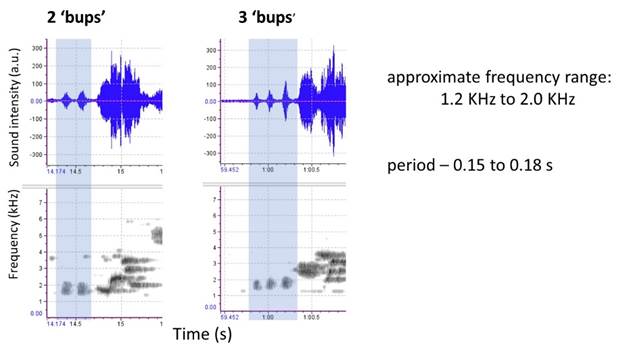
Fig. 1.15 Oscillogram and spectrograms of the WOTH-2 with 'p1' elements highlighted
Most of the 'p2' elements of the Wood Thrushes were different but we found two matching cases. Song A of WOTH-2 was similar to song B of the Mitch's Marina WOTH.
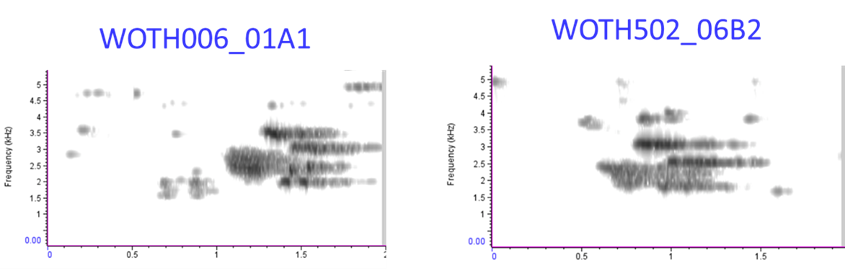
Fig. 1.16 Spectrograms of WOTH-2 (WOTH006) song A and song B of the Wood Thrush (WOTH502) singing in Mitch's Marina.
Song D of the WOTH-2 matched song B of the Millbrook WOTH. We compared the center frequencies and relative start times of WOTH-2 and Millbrook WOTH (Fig. 18). These parameters for the Millbrook WOTH are within the variations observed in the WOTH-2 song (Fig. 1.10b). These two birds share one song but not the other three.
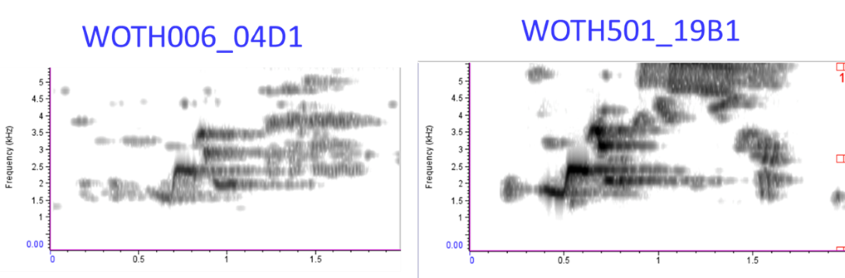
Fig. 1.17 Spectrograms of WOTH-2 (WOTH006) song D and Millbrook WOTH (WOTH501) song B.
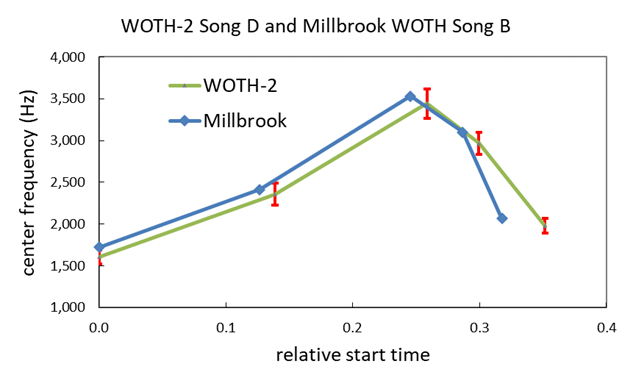
Fig 1.18 Center frequency vs. relative start time of the average of sixty-one WOTH-2 song D's and one song B of the Millbrook WOTH. Red error bars indicate the total variation (maximum - minimum) in WOTH-2 songs.
We did not attempt to compare 'p3' elements of these songs because of the poor recording quality of this element, often overlapping with the tail-end of 'p2'. Only if all the 'p2' elements in two birds match will we attempt to confirm the identity of an individual bird by comparing 'p3' elements as well.
WOTH-1 (Wood Thrush heard in 2021) Songs
Listen to the Wood Thrush singing in the Home 'patch' on May 16, 2021
Listening to David's video and viewing the spectrograms of the Wood Thrush in 2021, named WOTH-1, we discerned that this was a different individual. The twenty-eight second video captured four song types, labeled A, B, C, D in Fig. 1.19. The spectrograms of these four song types are shown in Fig. 1.20.
We compared the 'p2' elements of the WOTH-1 songs with the other four Wood Thrush songs reported earlier. His songs A, B and D are unique. There is a reasonably good match of his song type C with the Millbrook WOTH song type C (Fig. 1.21).
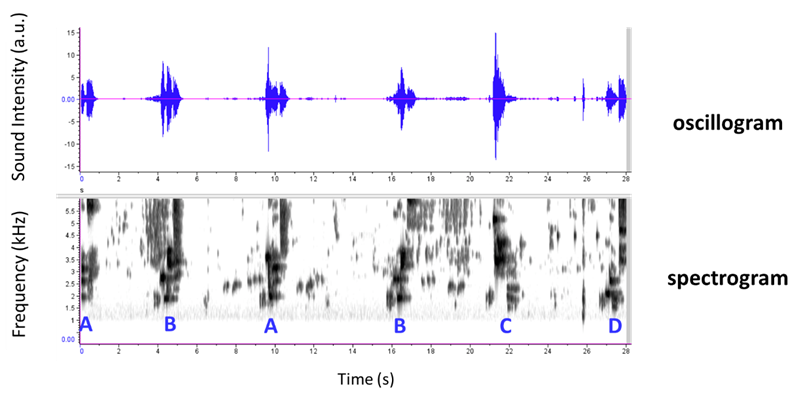
Fig. 1.19 Oscillogram and spectrogram of the video recording of WOTH-1 on May 16, 2021.
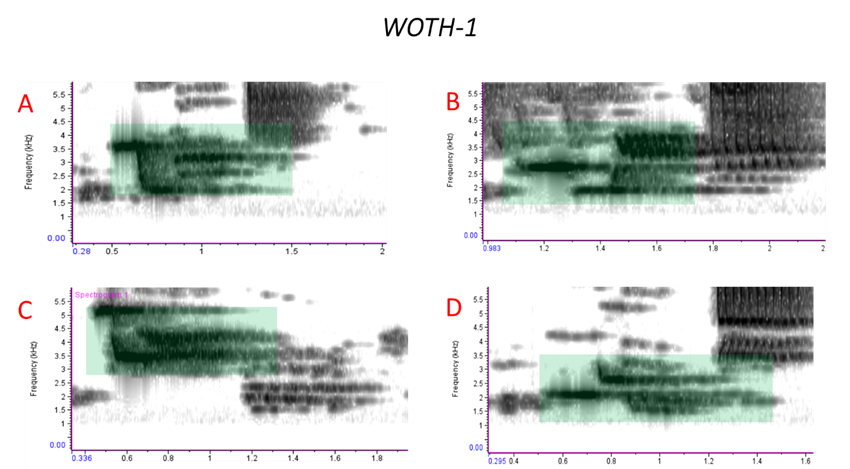
Fig. 1.20 Spectrograms of WOTH-1 songs A, B, C and D with 'p2' elements shaded in green.
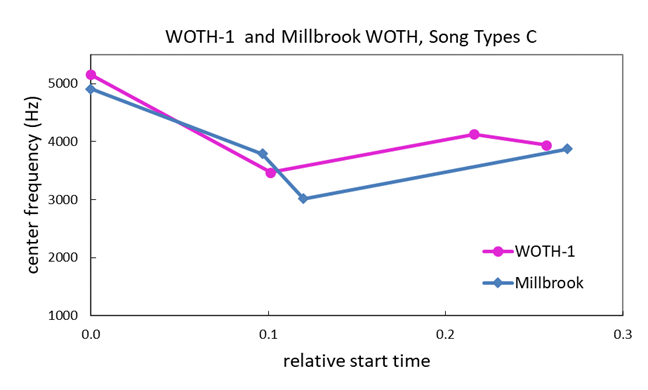
Fig. 1.21 Center frequency vs. relative start time of WOTH -1and MillBrook WOTH song types C.
The 'p1' element in this WOTH-1 songs had a slightly different signature than WOTH-2, Mt Holyoke and Millbrook WOTHs in that its frequency range was higher ~ 1.5 kHz to 2.0 kHz compared with 1.2 kHz to 1.5 kHz for the other three Wood Thrushes.
Common Features in Northeastern Wood Thrush Songs
All five Wood Thrush songs recorded by us exhibited distinct but temporal overlapping tones in the 'p2' elements. The differences in this part of the songs came from the tone frequencies, relative start times and the duration of each tone. The range of center frequencies of 'p2' elements of each Wood Thrush are listed in the Table below.
Further investigation of these tones and their relationship to music keys is discussed in Appendix B.
|
Wood Thrush Name |
Maximum Center Frequency (Hz) |
Minimum Center frequency (Hz) |
|
WOTH-1 |
5156 |
1594 |
|
WOTH-2 |
3617 |
1464 |
|
Mitch's Marina WOTH |
3704 |
1722 |
|
Mt Holyoke WOTH |
4306 |
1464 |
|
Millbrook WOTH |
4909 |
1722 |
Audio recordings were made with the Merlin App on an iPhone with a sampling rate of 44.1 kHz. In the spectrogram analysis, the minimum hop frequency (frequency step) is 86.133 Hz, and the corresponding minimum time step is 0.0058 seconds. Note that the error bars shown in Fig. 1.18 indicating total variation in center frequency are only 2 - 4X the minimum frequency step.
We attempted to remove background noise and other signals from the Wood Thrush audio recordings as much as possible without deteriorating the signals of interest. The cleanup process steps are listed below:
1. A band filter (1 Hz to 10 kHz) was applied in Raven software to eliminate low and high frequency noise.
2. Background noise reduction was carried out using Audacity software. After loading the filtered file, the Y-axis scale was changed to dB. A representative area with no Wood Thrush signal was selected to get the noise profile. Noise reduction in other areas was applied twice using the parameters in the screen shot in Fig. A1.
3. In some recordings background noise varied over the recording time. In such cases, noise reduction was carried out separately for different areas using noise profile from each area.
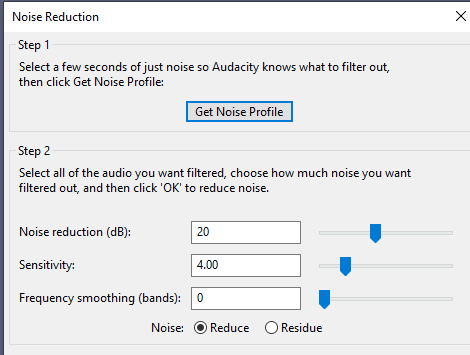
Fig. A1 Screen shot of noise reduction GUI in Audacity software.
Sources of Error in Song Analysis
Errors that may be introduced due to overlapping signals from sources external to the Wood Thrush vocalization, noise reduction procedure in Audacity and minimum frequency resolution in Raven are mentioned above. These may have a small impact on the estimated center frequency in each of the frequency bands in the 'p2' element of the song. Three additional sources of error are mentioned below:
1. Relative start time is dependent on the location of the rectangular box hand drawn by the user and may introduce an error of ≤ 0.02 s. Alternatively, the hand drawn box area may be isolated using a frequency band filter and the start time determined more accurately from the oscillogram. However, this procedure is more time consuming.
2. Overlapping 'p2' and 'p3' elements in some of the song recordings affect the center frequency of the 'p2' element. To minimize this error in comparing unique 'p2' elements of each bird, we attempted to select recordings in which no significant 'p3' elements were present whenever possible
3. High frequency signal attenuation varied with the location and surroundings of the Wood Thrush and may introduce a shift in center frequency.
Based on our analysis of Wood Thrush audio records, we are fairly confident that this process will identify a Wood Thrush by the 'p2' element of his song. We will have a chance to verify this claim next year by recording songs from a larger number of birds in the northeastern USA.
The 'p2' element of the Wood Thrush song heard in the northeastern USA has a musical quality very pleasing to the human ear. We see pure tones in spectrograms of these songs. It is interesting to note that the frequencies used by the Wood Thrushes fall on the music keys in the 6th and 7th octaves. The lowest frequency in the Wood Thrush song corresponds to the F sharp (F#) key in the 6th octave.
Music key frequencies in the chromatic scale follow the rule that starting with the lowest frequency f0, the frequencies of the subsequent higher keys are calculated as

where N = 1, 2 3 ... .
Music key frequencies starting with F#6 key (1479 Hz) set = 0 are plotted in Fig. B1. The WOTH-2 'p2' song frequencies shown in red dots are overlayed on the music key frequency differences. There is a strong similarity between the steps in the music keys and the steps in the pure tones of the Wood Thrush songs.
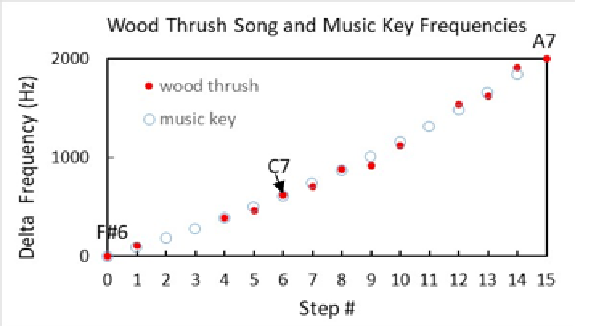
Fig. B1 Music key and WOTH-2 'p2' song frequencies above F#6 key frequency.
Another feature of the Wood Thrush is that each song type is followed by a different song type (Fig. 1.9) In Birdsong for the Curious Naturalist', Donald Kroodsma points out that some of the magic of the Wood Thrush is lost if the same song is repeated. He demonstrates this by artificially generating such recordings. See link: http://www.birdsongforthecurious.com/recording.php?page=133 for recordings ♫439 and ♫443 and compare with the original singing routine. Music appreciation is subjective, but most listeners would agree with this assertion.
Table B1 lists the center frequencies of each WOTH-2 song, the relative start time of the tone and the corresponding music key. The Wood Thrush is singing in the keys similar to F#6, G#,6, A#6, B6, C7, D7, D#7, E7, F#7, G7, G#7 and A7.
Table B1. WOTH-2 'p2' song center frequencies, relative start times and corresponding music keys.
|
Song A |
Center Frequency (Hz) |
Start Time (s) |
Music Key |
Key Frequency (Hz) |
|
|
2455 |
0.00 |
D#7 |
2489 |
|
|
3445 |
0.20 |
A7 |
3322 |
|
|
1960 |
0.32 |
B6 |
1975 |
|
|
2433 |
0.36 |
D#7 |
2489 |
|
|
2972 |
0.39 |
F#7 |
2959 |
|
Song B |
Center Frequency (Hz) |
Start Time (s) |
Music Key |
Key Frequency (Hz) |
|
|
2096 |
0.00 |
C7 |
2093 |
|
|
1493 |
0.26 |
F#6 |
1479 |
|
|
2354 |
0.31 |
D7 |
2349 |
|
|
1866 |
0.36 |
A#6 |
1864 |
|
Song C |
Center Frequency (Hz) |
Start Time (s) |
Music Key |
Key Frequency (Hz) |
|
|
3101 |
0.00 |
G7 |
3135 |
|
|
3560 |
0.26 |
A7 |
3520 |
|
|
2613 |
0.31 |
E7 |
2637 |
|
|
2153 |
0.36 |
C7 |
2093 |
|
Song D |
Center Frequency (Hz) |
start time (s) |
Music Key |
Key Frequency (Hz) |
|
|
1607 |
0.00 |
G6 |
1567 |
|
|
2357 |
0.14 |
D7 |
2357 |
|
|
3440 |
0.26 |
G#7 |
3322 |
|
|
2966 |
0.30 |
F#7 |
2966 |
|
|
1979 |
0.35 |
B6 |
1975 |
Hermit Thrush, another bird in the same Turdidae family as the Wood Thrush, has a similar musical quality in its songs. A study of Hermit Thrush songs by Doolittle et. al. (https://www.pnas.org/doi/abs/10.1073/pnas.1406023111) found that the frequencies selected by the birds were overtones of a fundamental frequency. Although there is sufficient evidence to support the overtone hypothesis, there is no physiological explanation of how such pitches are produced.
In our limited dataset, we found stronger evidence of the Wood Thrush preference to music keys in the chromatic scale than to overtones. This is illustrated in Fig. B2 which includes corresponding overtone frequencies overlayed in the plot in Fig. B1. The fundamental frequency of the overtones is set to 140 Hz to match the frequency steps in the Wood Thrush songs. Hence, these overtones are in the range of 10X to 25X of the fundamental. As in the case of a Hermit Thrush, the physiological basis of these frequencies is not apparent.
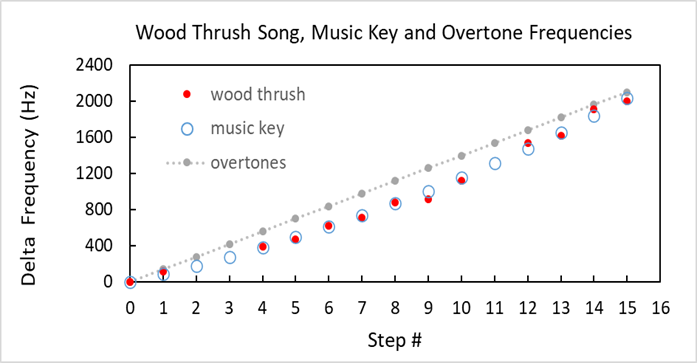
Fig. B2 Music key and WOTH-2 p2 song frequencies and overtones of a 140 Hz fundamental frequency above F#6 key vs. step #.
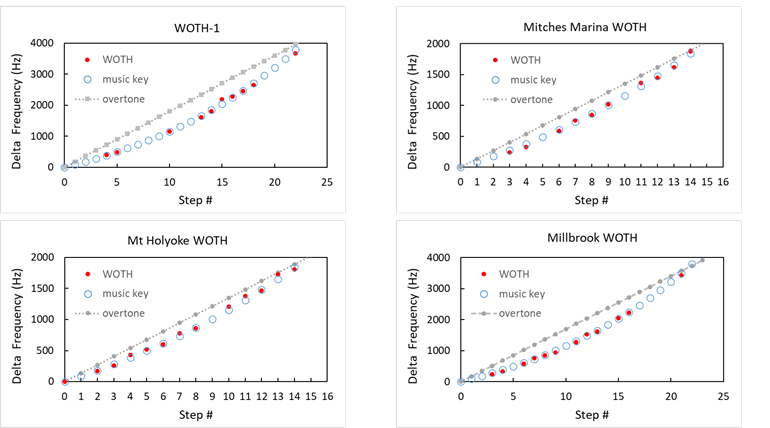
Fig. B3 Music keys and WOTH-1 and other three Wood Thrush 'p2' song frequencies and overtones of fundamental frequencies above F#6 key vs. step #.
Other Wood Thrushes showed similar preferences to music keys as shown in Fig. B3. The fundamental frequencies of the overtones for these recordings are in the range of 135 - 180 Hz.
It is fair to assume that the songs produced by a Wood Thrush establish his identity and thereby announce his presence to other Wood Thrushes in the neighborhood. They must be pleasing to himself and his mate. Additionally, his music pleases humans as well and helps us connect to nature on a common ground.
I often hear the melodic song of a Wood Thrush in the woods in this area but rarely get a chance to see one. In May 2021, my friend David and I saw and recorded a Wood Thrush singing in the woods in my Home 'patch'. The following year, in June of 2022, a Wood Thrush was singing all month in my 'patch', but I could not locate it. Was it the same Wood Thrush that visited the previous year? Perhaps his voice would give a clue.
Our team member Hemant and I studied the songs of several Wood Thrushes in 2022 and developed a methodology to identify an individual from the vocal 'fingerprint' of 'ee-oh-lay' parts of his songs (Audio Recordings and Analysis). One or more songs of an individual was distinctly different from the others which could be picked up by carefully listening to the audio recordings.
We learned that the Wood Thrush that sang in my Home 'patch' for a few days in May 2021 had a significantly different vocal signature than the one that sang in June 2022. We concluded that these were two different individuals. If either of these two birds returned after spending the winter somewhere in Central America over 2000 miles away, would we be able to identify the individual from his songs?
All through May and June of 2023 I eagerly awaited the return of the Wood Thrush. There was no sign of one in my 'patch' all spring and early summer. Then on July 28, a Wood Thrush serenaded early in the morning. Excitedly, I listened and recorded his songs. Again, on August 1, a Wood Thrush was singing away in the morning.
We established that the bird on July 28 and August 1 was the same individual. Additionally, all four of the songs in his repertoire were somewhat similar to the Home 'patch' Wood Thrush of 2022. Was it the same individual that returned after a year with an altered voice, an offspring of the 2022 bird, or another bird from the area near my 'patch'? We cannot be sure.
Readers are encouraged to listen to the Wood Thrushes singing in my 'patch' in 2021, 2022 and 2023 and render their opinion.
The periods in which a Wood Thrush sang in my 'patch' each year were different (Fig. 2.1). The one in 2021 was singing just after arrival from the south. The individual in 2022 was singing all through June which is the breeding season. The one in 2023 sang past the typical breeding time.
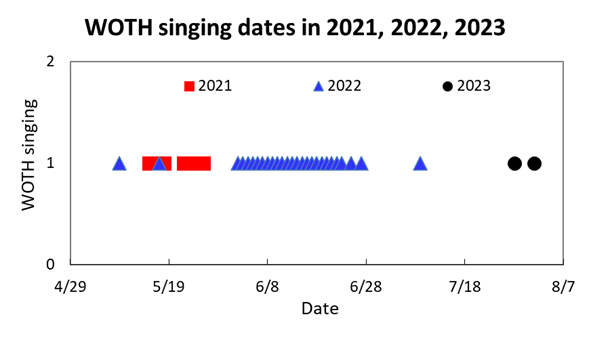
Fig. 2.1 Wood Thrush singing dates in the years 2021, 2022 and 2023.
We remind readers of the three parts, p1, p2 and p3 of a Wood Thrush song as shown in the oscillogram and spectrogram in Fig. 2.2. Our focus is on the characteristic p2 part, the well-known 'ee-oh-lay' birders associate with a Wood Thrush.
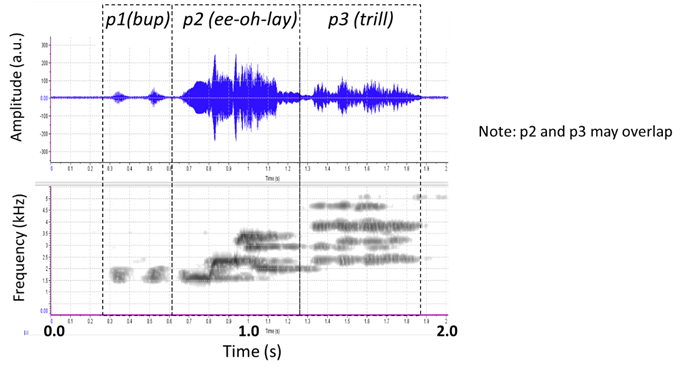
Fig. 2.2 The p1, p2 and p3 elements of the Wood Thrush song.
In the northeastern USA, we found that each Wood Thrush typically has four p2 song types, labeled song A, song B, song C and song D, and a preferred sequence in which the songs are delivered. In Fig. 2.3, the spectrogram of an audio recording of the 2022 Wood Thrush shows the song sequence A, B, C, D repeated three times. In no case was one song type followed by the same song type. For example, song A may be followed by song B, song C or song D but never by song A.
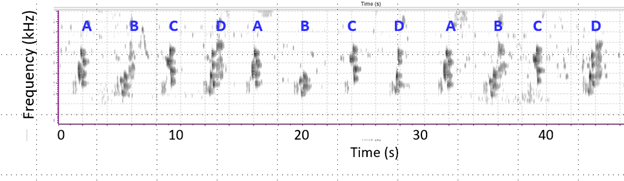
Fig. 2.3 Spectrogram of an audio recording of a Wood Thrush with song types A, B, C, D.
We compared the 'p2' spectrograms of the songs of the Wood Thrush heard in 2022 (WOTH-2) with the one heard in 2023 (WOTH-3). Fig. 2.4 compares the A, B, C and D song types of WOTH-2 with the ones that closely match the songs of WOTH-3.
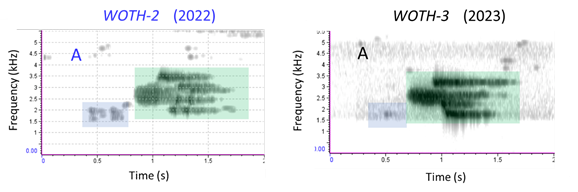
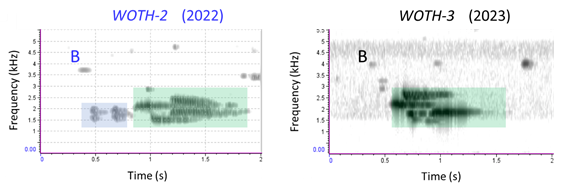
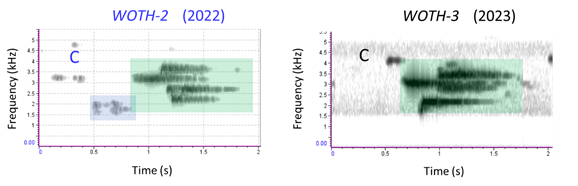
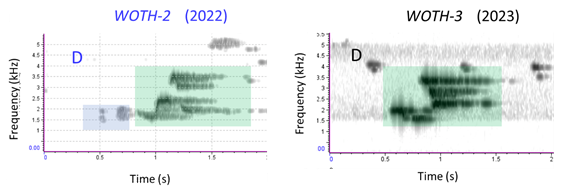
Fig. 2.4 Spectrograms of song A, song B, song C and song D of WOTH-2 with the ones that most closely match song types of WOTH-3.
Fig. 2.5 shows 2 x 2 matrices indicating how often one song type is followed by another song type. WOTH-2 had a clear preference to singing in the order A, B, C, D. WOTH-3 preferred A, D, B, C and even this preference was weaker than WOTH-2.
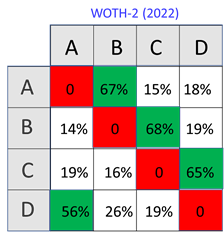
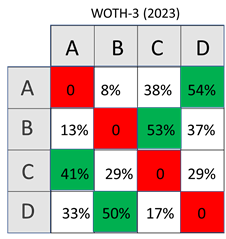
Fig. 2.5 2 x 2 matrices showing how often a song type was followed by same or another song type. Number of songs for WOTH-2 = 225 and for WOTH-3 = 65.
For a more precise comparison of how well a song is repeated by a Wood Thrush or matches another individual, we compare the central frequency vs. relative start time of each song type. See link for a more detailed description of our comparison methodology (Audio Recordings and Analysis). When we compared the four song types of WOTH-2 and WOTH-3, the signatures were clearly different for all songs. Song C of the two birds, which sounds more similar to our ears than the other three songs, has distinctly different patterns.
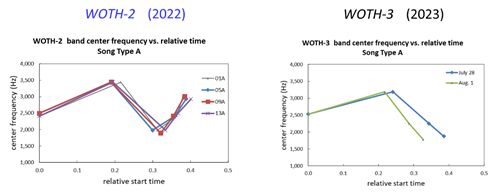
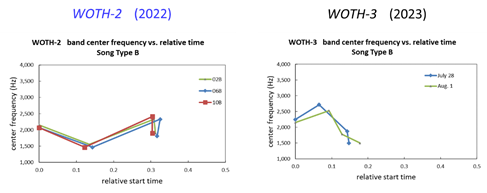
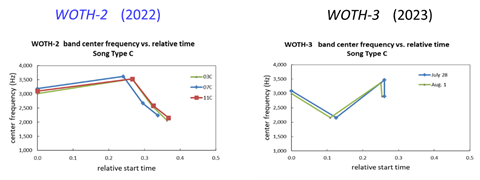
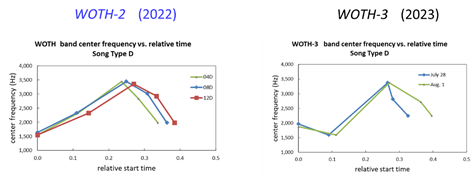
Fig. 2.6 Central frequency vs. relative start time of representative four songs of WOTH-2 and the two WOTH-3.
We understand that spectrograms views and interpretations of audio sounds by human brains may differ. To facilitate song comparison, we created a video in which the 'ee-oh-lay' or p2 parts of each song type extracted from 2022 and 2023 recordings are repeated four times. Readers may listen and render their opinion: Listen to Wood thrushes singing in 2022 and 2023
Earlier studies indicated that variations of the 'p2' phrase might identify individuals [1, 2]. The first of these studies by Borror and Reese was conducted on 25 Wood Thrushes in Ohio and published in 1959. The second study by Lanyon on hand raised Wood Thrushes and published in 1979 included recordings of seven wild Wood Thrushes, each having a unique repertoire.
In our study, we compared the songs of three Wood Thrushes in the same small 'patch' in the years 2021, 2022 and 2023. We wanted to learn if an individual bird returns to the same area without capturing and banding the birds. So far, we found that it is easier to differentiate individuals on the basis of their repertoire when at least one song is distinctly different as was the case of the Wood Thrushes heard in 2021 and 2022. The situation became more complex when comparing the 2022 bird with the one in 2023. All four of their song types were similar but not identical. Is the repertoire of an individual bird modified over time? Is the repertoire of an offspring nearly similar to the parent? There is much to learn.
We hope that a Wood Thrush will sing in the Home 'patch' in future years and give us an opportunity to learn more of their behavior.
References:
1. Donald J. Borror, Carl R. Reese "Vocal gymnastics in Wood Thrush songs", Ohio Journal of Science vol 56, pp 77-182, 1956.
2. Wesley E. Lanyon, "Development of Song in the Wood Thrush (Hylocichla mustelina), With Notes on a Technique for Hand-Rearing Passerines from the Egg". American Museum Novitats, vol.2666, pp 1-27, 1979.
On the morning of May 7, 2024, I heard a Wood thrush singing in the woods behind my house. I was delighted as this was the fourth year in a row that a Wood Thrush was in my Home 'patch'. The bird was singing again at dusk, and also at dawn the next morning. After a gap of two weeks, I heard a Wood Thrush again at dusk on May 22. Another gap of two weeks, and a Wood Thrush was back in the woods singing on June 4, June 7 and June 11. From then on till July 7, a Wood Thrush serenaded on most mornings - sometimes for several hours. Fig. 3.1 shows the dates on which a Wood Thrush was heard. Sighting the bird in the dense foliage was not possible even though his resonant voice came clear through the woods announcing his presence and giving a clue to his identity.
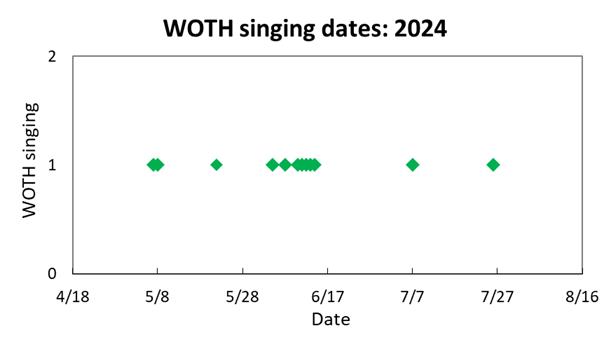
Fig. 3.1 Wood Thrush singing dates in my Home 'patch' in 2024.
At least once each day that a Wood Thrush was heard, I made audio recordings on a Zoom H4n Pro or on iPhone14 using Merlin App. Was it the same Wood Thrush singing all through the 2024 season? Had a Wood Thrush heard in my Home 'patch' in the previous three years returned?
As described in Audio Recordings and Analysis, a Wood Thrush's identity is revealed in the spectrograms of the 'ee- oh-lay' parts of the four or five songs in his repertoire. From the audio recording analysis, we found five unique song patterns in 2024, concluding that there were five different Wood Thrush visitors this year. We named these following the sequence generated in the previous three years: WOTH-4, WOTH-5, WOTH-6, WOTH-7 and WOTH-8. Four of these birds passed through in early spring and the fifth (WOTH-8) stayed in the vicinity for over a month as indicated in Fig. 3.2.
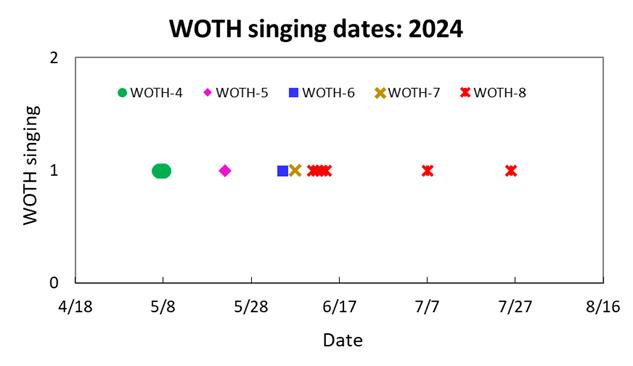
Fig. 3.2 Wood Thrushes identified in my Home 'patch' in 2024.
The oscillograms and spectrograms of the five audio recordings, obtained using Raven Pro software developed by Cornell University, are shown below. Sometimes loud songs of Carolina Wren, Northern Cardinal, or American Robin overlapped with the Wood Thrush songs, and there were other (noise) sources present. We extracted the best recording of each song type and filtered the noise to generate the representative songs heard each day. For ease in comparing these songs, we arranged them in order A, B, C, D, E. Hence, these songs are not necessarily named in the preferred order used by an individual bird. Readers may listen to these recordings on YouTube using this link: Wood Thrushes singing in my Home 'patch' in 2024
The oscillograms and spectrograms of representative songs of each of the five different Wood Thrushes are shown in Figs 3.3, 3.4, 3.5, 3.6 and 3.7. The A, B, C, D, and E songs are labeled with the Wood Thrush number after the song type. As an example, song A of WOTH-4 is labeled A4. For each Wood Thrush, the most distinctly unique song, confirming his individuality, is circled in red. The sequence in which the songs were delivered and the total recording time for that sequence are also listed. Note the characteristic pattern of a Wood Thrush where each song type is always followed by a different song type. This must have been particularly challenging for WOTH-6 which had only three songs in his repertoire.
WOTH-4
Audio recordings on May 7, and 8, 2024
Song sequence in 70 seconds recording with 16 songs:
B4, D4, C4, A4, B4, D4, C4, A4, B4, D4, C4, B4, A4, C4, D4, B4
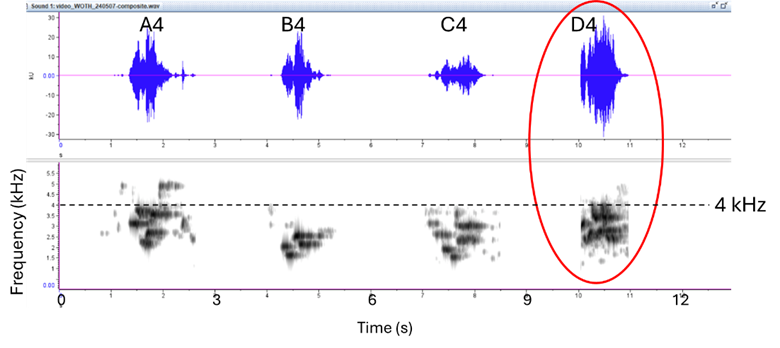
Fig. 3.3 Oscillogram and spectrograms of representative WOTH-4 songs.
WOTH-5
Audio recordings on May 22, 2024
Song sequence in 40 seconds audio recording with 7 songs:
Song sequence:A5, B5, C5, D5 , B5, A5, C5
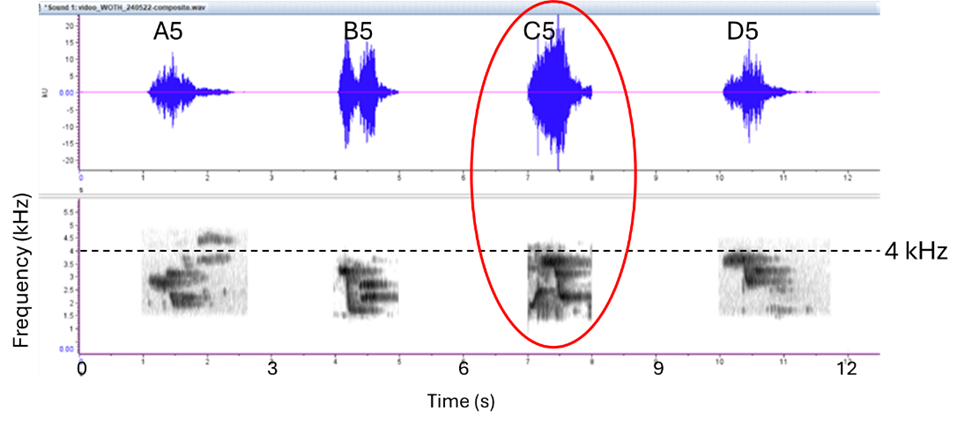
Fig. 3.4 Oscillogram and spectrograms of representative WOTH-5 songs.
WOTH-6
Audio recordings on June 4, 2024
Song sequence in 200 seconds recording with 35 songs:
C6, A6, C6, A6, B6, C6, A6, B6, C6, A6, B6, C6, A6, B6, C6, A6, B6, C6, B6, A6, B6, C6, A6, B6, C6, A6, B6, C6, A6, B6, C6, A6, B6, C6, A6
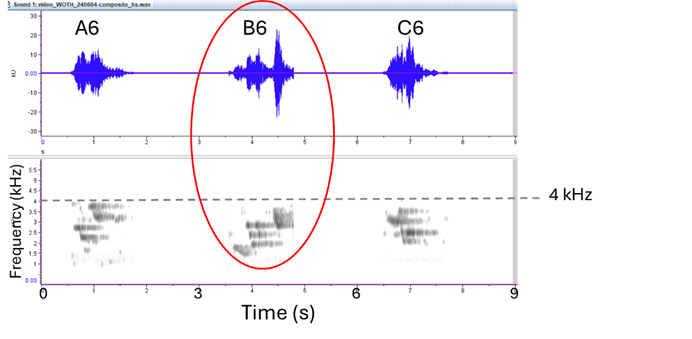
Fig. 3.5 Oscillogram and spectrograms of representative WOTH-6 songs.
WOTH-7
Audio recordings on June 7, 2024
Song sequence in 215 seconds recording with 42 songs:
C7, D7, B7, A7, E7, A7, C7, D7, B7, C7, A7, E7, D7, C7, A7, B7, D7, C7, E7, A7, D7, C7, B7, A7, C7, D7, E7, B7, C7, A7, D7, C7, A7, B7, E7, A7, C7, A7, D7, B7, A7, D7
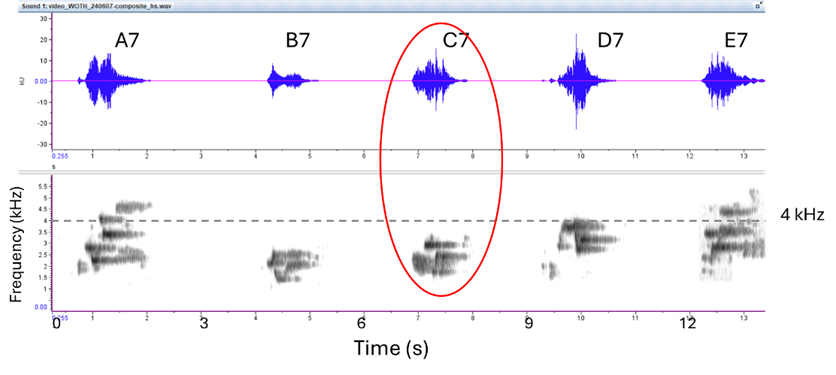
Fig. 3.6 Oscillogram and spectrograms of representative WOTH-7 songs.
WOTH-8
Audio recordings on June 11, 12, 13, 14, and July 7 and 26, 2024
Song sequence in 130 seconds recording on June 11 with 33 songs:
C8, D8, A8, B8, D8, C8, B8, C8, D8, A8, B8, C8, D8, C8, B8, A8, C8, D8, C8, B8, A8, D8, C8, B8, D8, B8, A8, D8, C8, D8, C8, B8
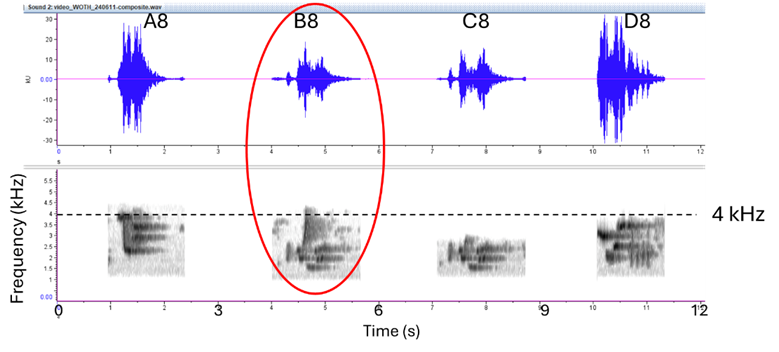
Fig. 3.7 Oscillogram and spectrograms of representative WOTH-8 songs.
WOTH-8 songs were recorded on five different days. The spectrograms for all four of his song types were comparable on all days. We checked the day-to-day repeatability by plotting the central frequency and relative start times of his B8 song on different days. The patterns are all similar, with some of the scatter in frequency and relative start time likely arising from noise and fuzziness in the sepctrograms.
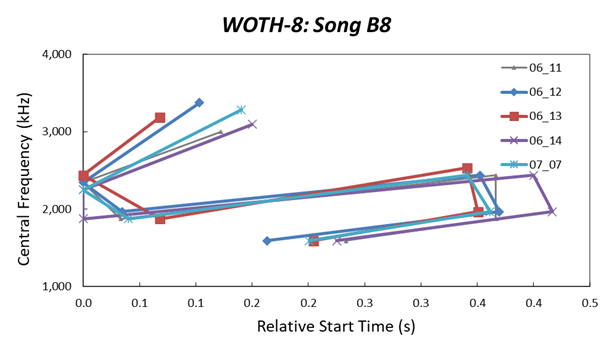
Fig. 3.8 Central frequency and relative start time of song B8 extracted from recordings made on five different days.
In the last four years, we witnessed eight different Wood Thrushes in the Home 'patch' based on the assumption that a Wood Thrush maintains a unique repertoire throughout his life. We will continue this study in future and learn more about their movements in spring and summer using passive acoustic monitoring developed here.